Trending Assets
Top investors this month
Trending Assets
Top investors this month
lululemon Athletica Inc. - It’s all about branding
⚠ Our $LULU write-up is out!!! ⚠
This is the first write-up of 2023 so make sure that your sign-up to our newsletter to receive future posts in your inbox.
The below is an extract of our write-up on lululemon athletica (Ticker: $LULU ), one of the key players in the athleisure space. The extract covers Key Facts (1) and various subsections of Business Overview (2). Our full report covers among others, financials, industry analysis, valuation and more.
If you are interested to read more here is the link -> lululemon Athletica Inc. - It’s all about branding
-------------------------------------------------------------------------------------------------
1.KEY FACTS
Description: lululemon Athletica Inc. (“LULU”, “Lulu”, and “Company”) is engaged in the design, distribution, and retail of technical athletic apparel, footwear, and accessories, mainly sold through company-operated stores (“COS”) and direct to consumer (“DTC”) e-commerce. The Company, as of 30 October 2022, operates globally through 623 COS with the majority located in United States (337), China (105 – including Hong Kong and Taiwan), Canada (66), Australia (31) and UK (16).
Key Financials: Over the period FY12 to Q3’FY22, the Company depicted a revenue and operating income Compound Annual Growth Rate (“CAGR”) of 19% and 15.9%, respectively, reaching a Trailing Twelve Month (“TTM”) revenue of c. $7.5B and operating income of $1.6B (margin of 21.4%). LULU has Cash and Short-term investments of $353 million compared to lease liabilities amounting to $1,039 million. Cash position was abnormally low due to the investments in inventory in Q3’FY22 so as to meet demand.
Price & Market Cap (as of 20th January 2023): Its market cap is $39.9 billion with a 52-week high of $410.7 and a 52-week low of $251.51, whereas it currently trades at $312.80.
Valuation: LULU trades at a TTM EV/EBITDA of 21.7 (10 Year average of 22.4) and at a TTM P/E of 33.8 (10 Year average of 40.5).
*Note: Fiscal Year (“FY”) of Lulu ends on the Sunday closest to January 31 of the following year (i.e. FY21, year ended 30 Jan 2022).
2.BUSINESS OVEVIEW
Lululemon in a nutshell
Lulu was founded in 1988 in Vancouver, Canada and its initial public offering took place in July 2007. Since its inception it delivered a total return of 2,134.29% (per Koyfin) translating into a compound annual return of c. 22%.
Although it started as a company offering yoga pants to women, it expanded its offering providing technical athletic apparel, footwear and accessories to both men and women. The versality of its products/offering meets the needs of people who do yoga, run and train and those involved in other activities such as tennis, golf and hiking.
From a single store in Vancouver, Canada in 2000 to 623 company-operated stores across the globe with United States (337 stores) being its largest market as of today. Although, the number of stores expanded considerably brand awareness is still low and the potential for growth seems huge. More on this later.
If interested to read more about the history of LULU you can read the article written by our friend @eggplant Elastic Growth, Lululemon and more specifically section “The Brief History of Lululemon”.
Reporting segments
The Company has 3 reporting segments, namely, Company-operated stores, Direct to consumer and Other.
Company-Operated stores account for 46% of sales or $3.4B on a TTM basis (45% in FY21) and these are the sales generated through its 623 stores. The operating margin for COS (excludes general corporate expenses) since FY12 until today (excluding FY20) averages at 27%.
Direct to Consumer (e-commerce) account for 44% of sales or $3.3B on a TTM basis (44% in FY21) and these are the sales generated through ecommerce. LULU operating as an Omni-channel allows a guest to shop both in store and online. As per management, when a store-only guest shops online becomes an Omni-guest and spends approximately 30% more. The operating margin for DTC (excludes general corporate expenses) since FY12 until today averages at 42%.
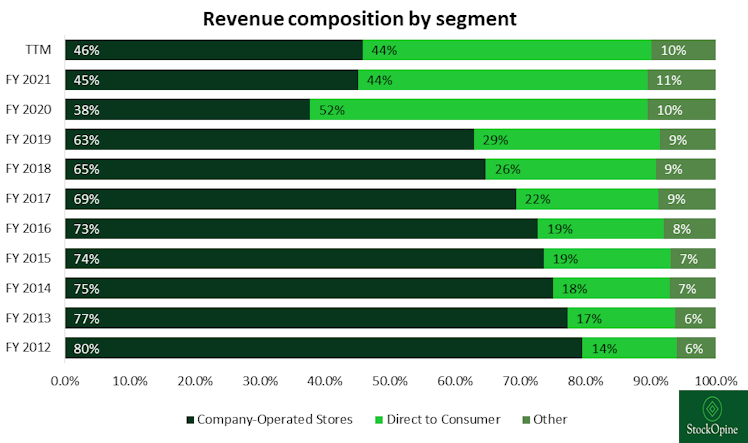
Source: Stratosphere.io, StockOpine analysis
Considering the high margin of DTC business, it’s no coincidence that the initial Power of Three in April 2019 (more on this later) targeted for doubling DTC sales over a 5-year period. COVID pulled forward the demand and helped in smashing this target in FY20. The trend is upwards showing resilience and through the Power of Three x2 in April 2022, management targets for another doubling of DTC sales, i.e. exceeding $5.5B.
The higher margin of DTC is expected since costs like rent, electricity, and wages are minimized relative to COS. The value proposition in growing DTC is further supported by the lower Capital expenditure (“CAPEX”) requirements (average 2% of sales) compared to COS (average 6% of sales). Higher margin, lower CAPEX implies better returns on invested capital.
Other includes the remaining types of distribution to end customers (e.g. outlets, temporary locations – 60 in North America, sales to wholesale accounts, license and supply arrangements – mainly in Mexico and Middle East countries – total 22 stores, and recommerce – sales of repurchased Lulu products) as well as sales to its connected fitness customers through lululemon Studio (formerly known as MIRROR). The operating margin for Other (excludes general corporate expenses) since FY12 until today (excludes FY20) averages at 14%.
We believe that all segments are important to the future success of the Company with each having its own weight. DTC might seem the ideal segment, but without physical stores brand awareness would have been limited (it is already low). License and supply arrangements require less CAPEX but Lulu still gets the exposure to new markets, raising brand awareness, and providing the Company with an opportunity to sell through its e-commerce channel. Pop-ups allow to test the waters in new markets, capture seasonal demand and reach new guests. ‘Like New’ (recommerce of repurchased products) which went live to all US stores in April 2022 allows users to trade-in clothing in good condition and get e-gift credit that they can use on new items. The old items are revived and become available for sale at a lower price. This is a win-win situation for the Company and its customers. Existing users are encouraged to purchase again from Lulu (as they get e-gift cards) while it also attracts new users of lower income classes who want to get quality at price levels which are not restrictive anymore. Does it ring a bell? To us yes, ‘Network Effect’ is calling. On top of this, profits from the program go directly to the sustainability initiatives of Lulu.
Revenue by Category
Since FY17, the Company disaggregates its revenue into Women’s product, Men’s product and Other categories (accessories, lululemon studio and footwear). Women’s product is the chunk of revenue accounting for 65% or $4.9B on a TTM basis (71% back in FY17) while Lulu is also becoming more appealing to Men as revenue grew from $527M in FY17 to $1.8B on TTM basis (or from 20% weight to 25%).
Men’s doubling of revenue was another Power of Three (Apr 2019) target that was achieved earlier than the 5 year horizon. From $691M in FY18 to $1.5B in FY21 and expected to exceed $3B by FY26 (New Target under Power of Three x2 – April 2022).
Lastly, other segment (10.5% of sales on TTM) is what completes the offering of Lulu, for which management strives to continuously broaden its merchandise. It grew from $230M in FY17 to $783M on a TTM basis (CAGR of 29.4%).
lululemon studio (included in Other) is the connected fitness segment which does not seem to be performing as expected, yet the expectations are there.
Meghan Frank, CFO “It is important to note that while footwear and our evolved lululemon studio, MIRROR model are exciting long-term opportunities for us, we have taken a conservative approach to how we've contemplated them in this plan. And over the next 5 years, we are forecasting the combined penetration of those 2 pieces to be in the mid-single digits, lower in the near-term years and higher in the outer years.”
With the transition from MIRROR to lululemon studio and the new membership program announced on September 2022, management seems excited with its offering, and is on the right track in achieving the target of signing 80% of their guests to the program (on the free membership). Yet, we consider lululemon studio as an upside, with membership programs providing positive externalities to the rest of the business rather than being a driver of future performance. Needless to say that there is an ongoing litigation for certain infringement of patents in which the Administrative Law Judge issued Initial Determination recommending Exclusion Order and Cease and Desist Order against the Company (Company filed a petition).
Footwear is another step taken by the Company to enhance its offering.
Calvin McDonald, CEO, “it shows the ability to identify unmet needs even in a category like footwear and then how we innovate, how we bring that to market. So I think it's a great example to just demonstrate that there is a lot of opportunity when you focus on innovating behind unmet needs regardless of the category in which you're trying to do it in.”
In March 2022, it announced its official entrance to footwear with four innovative women’s styles and revealed the plan to do the same for men in 2023. Not their core business and not a significant component of the Power of Three x2 equation, however, a milestone towards offering the “head-to-toe” solution to its customers. We presume that margin wise there would be insignificant impact as the Direct-to-Consumer (both own stores and ecommerce) sales of Skechers USA Inc., which primarily sells shoes, has a margin that oscillates around the 65% level (Lulu has 5 year average gross margin of 56%).
Geographic mix
The majority of Lulu’s revenue is generated from the US which is considered along with Canada, the two most mature markets. This by no means translates to a lower expected growth as the expectation is for over $8B in revenues by FY26 compared to $5.3B in FY21. Nevertheless, the opportunities abroad seem massive in relative terms.
US accounts for 69% of its sales on a TTM basis i.e. revenue of $5.2B (CAGR of 20.5% since FY12), whereas Canada and International sales had a similar weight and revenues of $1.1B (CAGR of 9.4% since FY12) and $1.2B (CAGR of 34% since FY12), respectively. While not disclosed explicitly, based on the scale of US and the comments made by management, it appears that this is a more profitable region at this stage.
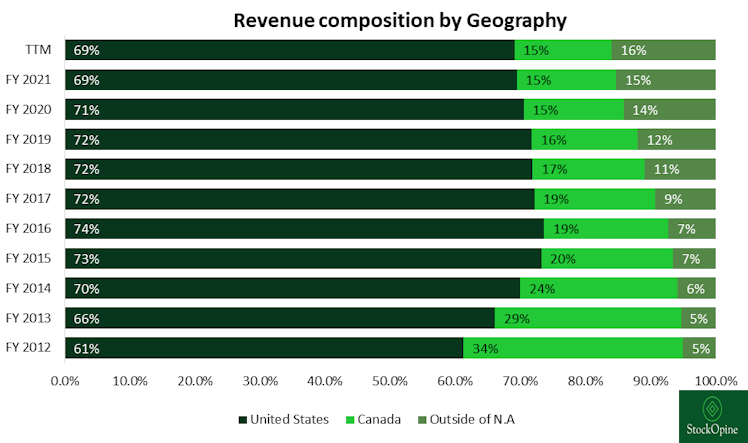
Source: Stratosphere.io, StockOpine analysis
In its Power of Three (April 2019) the Company targeted to quadruple its international sales from $360M to $1.4B. It is not there yet but it achieved 83% of this target on a TTM basis. If China zero COVID policy was not enforced this target could have been possibly achieved 100%. Per Power of Three x2 the target remains unchanged. Quadruple sales of $957 in FY21 to reach c. $3.8B by FY26 with China expected to be its 2nd largest market, while the number of stores in China is expected to triple.
Opening new stores, increasing sales per store, growing DTC channel, enhancing offering through product innovations and raising brand awareness are the growth drivers for LULU, both in North America and internationally.
The below pie chart represents the store composition as of 30 October 2022. As it can be observed, US and China (including Hong Kong, Taiwan and Macao) are the leading regions in terms of stores. From the “All other” category Germany with 10 stores and New Zealand with 8 are the most significant.
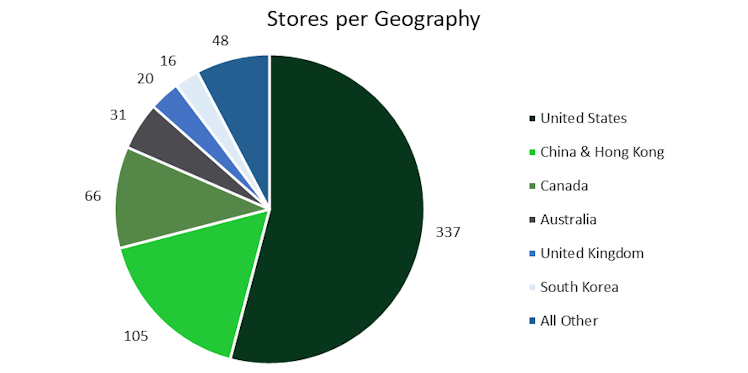
Source: Latest 10Q filing, StockOpine analysis
Even though, the number of stores drives revenue growth it does not necessarily mean that each store reaches its full potential from Day 1. For example, Canada has much lower number of stores, yet similar revenues to the rest of the international locations. This disproportionate relationship is further justified by the graph below which shows that when a new region was introduced, revenue per store declined. E.g. in FY14 it entered the UK market, in FY15 the China market, in FY16 the South Korean market while at the same time stores in US (and China after FY15) were growing exponentially.
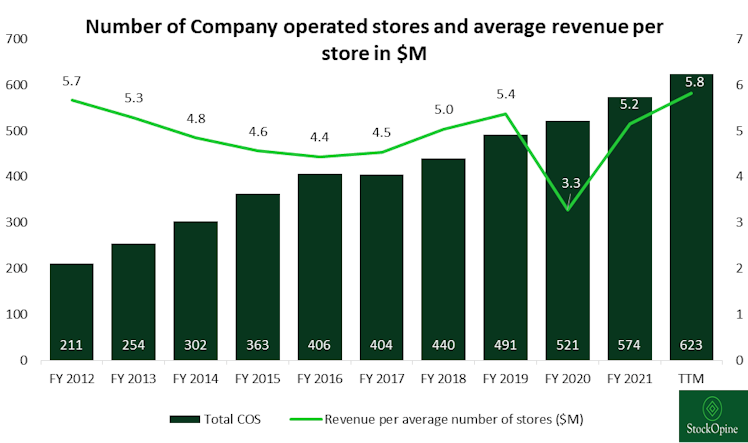
Source: Stratosphere.io, StockOpine analysis
Going forward, the Company expects to grow stores at double digit rates.
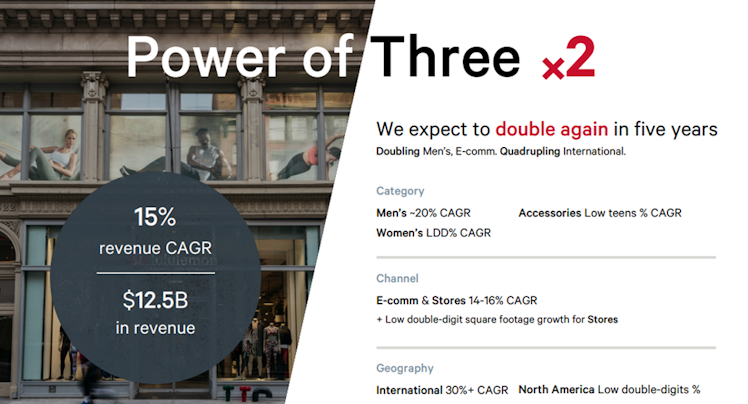
Power of Three x2
Power of Three x2 is the revised strategy / aspiration of Lulu for the next 5 years (released in April 2022) and has 3 key Pillars; a) Double Men’s Product, b) Double DTC and c) Quadruple International by 2026 while at the same time continue to grow Women’s products and North America at double digit rates. On successful implementation and execution of this plan, management expects to generate a revenue CAGR of 15% reaching total sales of c. $12.5B compared to $6.3B in 2021.
We trust that management will execute on the key pillars, if not exceed them. Why? Well, execution to date and the untapped market is what makes us believe that this is achievable. In the last 5 years Lulu missed analysts’ revenue estimates only on two occasions while it missed EBIT estimates just once! Additionally, when the initial Power of Three plan was unveiled in April 2019, the Company set among others the exact same targets, a) Double Men’s Product, b) Double DTC and c) Quadruple International sales by FY23. The result? Smashed Men’s and DTC targets in FY21 and FY20, respectively whereas on a TTM basis the international sales target is 83% achieved. Early achievement of those goals resulted to the revised plan in April 2022.
“We remain early in our growth journey, with our strong product engine, proven ability to create enduring guest relationships, and significant runway in core, existing, and new markets. Following our compelling track record of delivering against our goals, I am excited about taking our growth strategies to the next level to serve more and more guests around the world.” Calvin McDonald, CEO
The remaining financial goals include EPS growth exceeding sales growth, modest annual operating margin expansion, growth of annual square footage in the low double digits (5%), tax rate of 30%, unit inventory growth in line with sales and 7%-9% Capital expenditures.
Source: LULU Investors Day presentation, April 2022
-------------------------------------------------------------------------------------------------
If you enjoyed this extract, you will definitely love the full write-up -> lululemon Athletica Inc. - It’s all about branding
Disclaimer: The team does not guarantee the accuracy or completeness of the information provided in the newsletter. All statements express personal opinions based on own financial and business analysis. Any estimates or forward-looking statements made are inherently unreliable. No statement of opinion is an offer or solicitation to buy or sell the financial instruments mentioned. The content of our newsletter is not a trading or investment advice and we do not provide any personal investment advice tailored to the needs of any recipient. This post may contain affiliate links, which means that we might get a commission if you decide to sign-up using any of these links. No extra cost is charged to you.
stockopine.substack.com
lululemon Athletica Inc. - It’s all about branding
lululemon Athletica Inc. is engaged in the design, distribution, and retail of technical athletic apparel, footwear, and accessories,, mainly sold through its 623 company-operated stores and e-commerce.
Already have an account?