Trending Assets
Top investors this month
Trending Assets
Top investors this month
SLT Core Portfolio: Visa ($V) - The Middle Man We All Carry In Our Wallet.
The idea to analyze Visa was generated by our Quality-Growth screener. V is one of this company that actually does not need a long introduction. The payment giant operates a transaction processing network that enables authorization, clearing, and settlement of payment transactions. V provides services in more than 200 countries to individual consumers, merchants, financial institutions, and governments.
Even if the company is well known, it is important to precise that V does not issue credit or debit cards, but card services to consumers and businesses. V’s clients (using the network and/or other services) are the ones that issue the actual cards. The company was founded in 1958, is headquartered in San Francisco, CA and currently employs c.26,500 people.
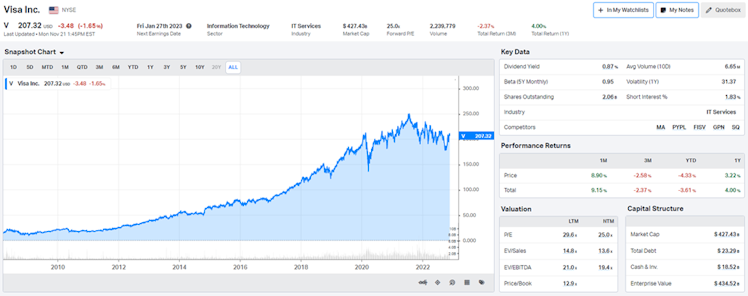
Source: koyfin
Thesis
- V is the clear digital payment leader and has been able to increase market share thanks to its powerful two-sided network effects, supported by a valuable brand.
- The company is a key player in one of the biggest secular trend we are experiencing: the shift to digital payments and cash-less transactions. Driven by the increasing share of e-commerce and accelerated by the pandemic, it offers attractive factors of growth for V. Building blocks are in place to capture the next 10x growth opportunity.
- V enjoys above-competitors healthy and increasing margins (c.67% operating margin), and thanks to scale, has increased returns faster than revenue. The company is well positioned to sustain track record of superior revenue, EPS growth, and strong FCF generation.
- World-class management team executing a disciplined capital allocation strategy to fund growth and create shareholder value. Over the last 5 years management opted for a more efficient capital structure, managed within reasonable parameters, maintaining balance sheet strength while improving ROE and reducing WACC.
- V currently trades at a discount to its intrinsic value using both absolute/relative multiples and DCF model methodologies. Reverse DCF implies (only) a single-digit growth for the next decade. We believe current price offers investors to buy a great business at a reasonable price.
Business Model
In an example of a typical Visa C2B payment transaction, the consumer purchases goods or services from a merchant using a V card or payment product. The merchant presents the transaction data to an acquirer, usually a bank, for verification and processing. Through VisaNet, the acquirer presents the transaction data to V, which in turn contacts the issuer to check the holder’s account or credit line for authorization. After the transaction is authorized, the issuer effectively pays the acquirer an amount equal to the value of the transaction, minus the interchange reimbursement fee, and then posts the transaction to the consumer’s account.
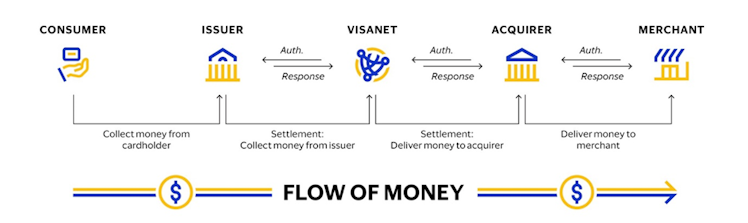
Source: Visa 10K 2022 filing.
In other words, V acts as a middleman that enables all of these institutions to speak to each other so that you can pay for your good at the store quickly, conveniently and securely and V gets paid a tiny fee every time a transaction is made on VisaNet. The typical interchange rate for V in the US is 1.4%-2.5% for credit cards and 0.5% for debit cards. Interchange fees are lower in Europe due to limits introduced by regulators.
When reporting its revenue, the company divides it in 4 different gross revenue sub-segments, then subtract client incentives to derive net revenues.
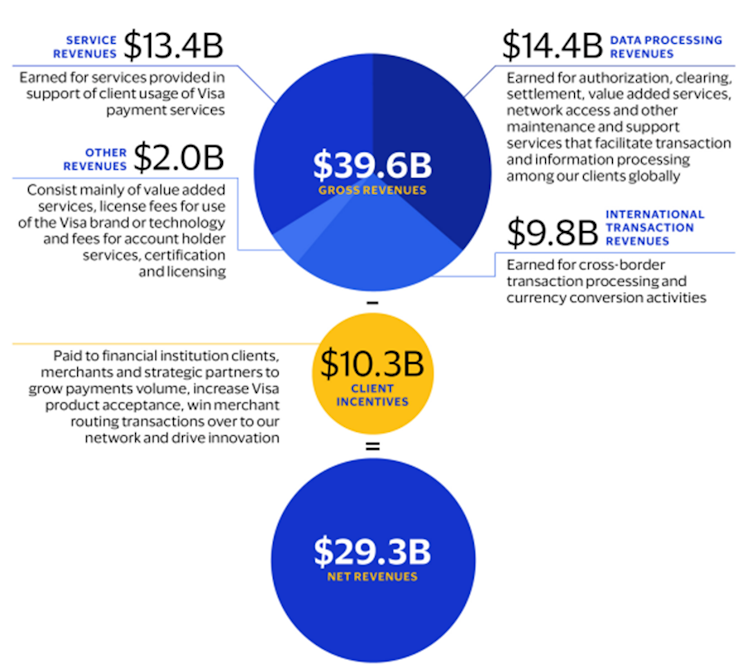
Source: Visa 10K 2022 filing.
Competitive Moats
Referring to our friends @ifb_podcast, “one of the longest-lasting 2-sided network effects in the world is Visa”. The network effects moat source has become more relevant as our world has grown more digital. It describes the phenomenon where the value of a product or service increases as the number of its users grows.
Morningstar has given V a wide moat rating and writes: “As consumer spending around the world grows and digital methods continue to take share from cash, Visa should continue to flourish for years to come as an effective toll booth on global spending. Visa has been coordinating the interaction of banks, consumers, and merchants for decades. Its effective network consists of 16,800 financial institutions, 44 million merchants, and billions of cards issued to customers around the world. This creates a formidable barrier to entry.”
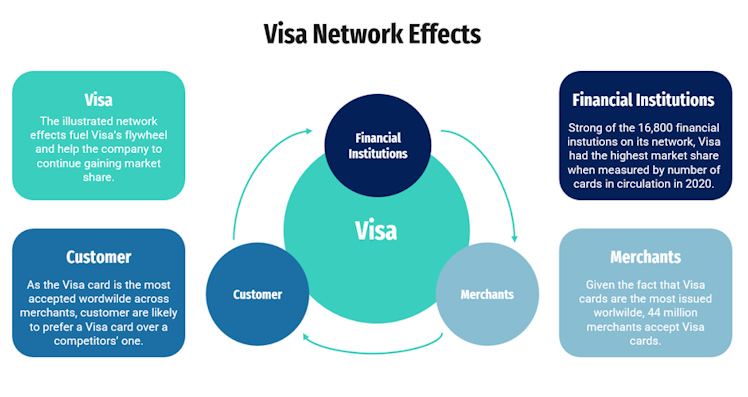
Source: SLT Research
This large network feeds V’s network effects as illustrated above. As more institutions issue V cards for their clients, more merchants are likely to accept V cards. As more merchants accept V cards worldwide, more customers are likely to order a V card to their financial institution. And the flywheel goes on and on…
The above moat is supported and fueled by the power of V's brand. The brand is preferred around the world and across priority audiences.
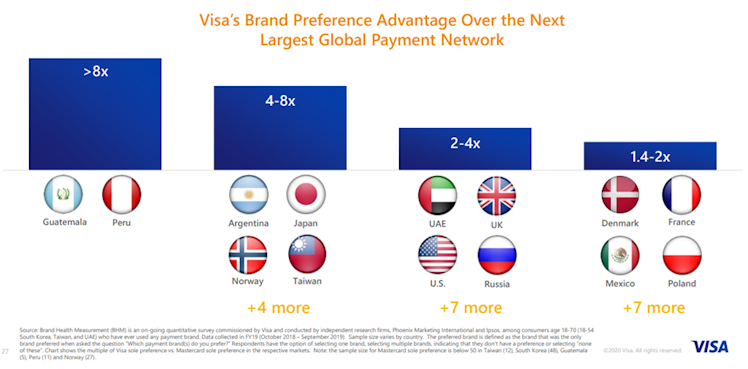
Brand Finance has calculated the value of the V brand 14 times between 2009 and 2022. The V brand valuation has featured in 35 brand rankings, including the strongest and most valuable US brands, the biggest banking brands and the best Global brands.
As a result, V is the clear leader both in terms of credit card issued and purchase volume.
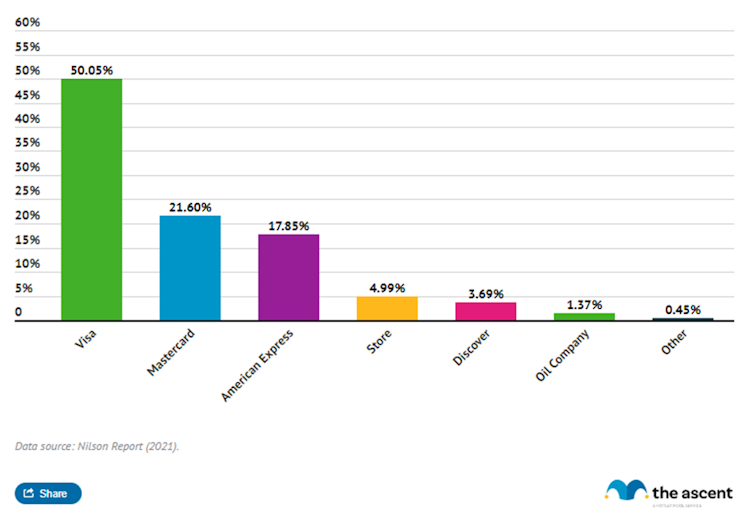
Title: credit card market share by purchase volume / source.
Sustainable Growth
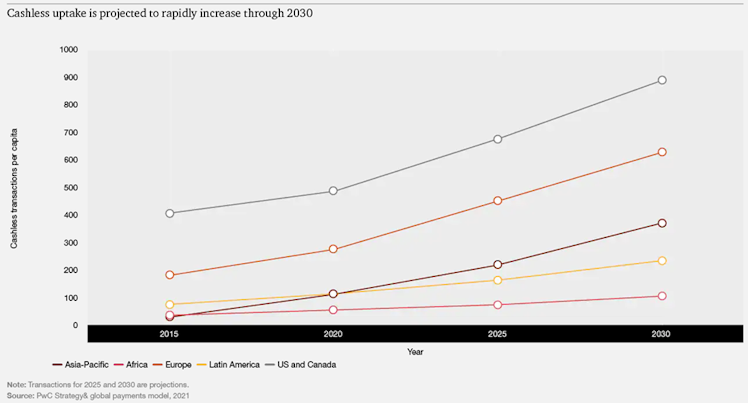
The ongoing move to cashless payments has emerged as one of the most attractive secular trends within global stock markets. Even before the pandemic, alternative (to cash) ways of paying for goods and services were evidence of a steady shift to digital payments, a shift that might ultimately lead to a cashless global society. According to PwC analysis and driven by a rapid and permanent customer shift to digital payments, non-cash payments are poised to firstly grow at c.13% CAGR (2020–2025) and then at c.10% CAGR between 2025 and 2030, to reach 1.9tn in transactions volume by 2025 and 3tn by 2030.
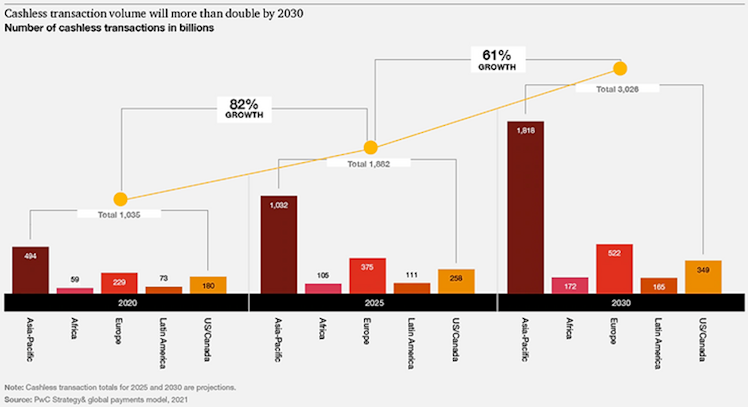
APAC is expected to be the frontrunner in the race and, in 2025 and 2030, the region
will represent more than half of global non-cash transactions. In Europe, mobile payments and cross-border e-commerce will drive the region beyond 500bn transactions by 2030. Latin America and the Middle East and Africa (MEA) represent a favorable environment for digital payments growth due to the strong demand for e-commerce, mobile payments, and a flourishing fintech ecosystem.
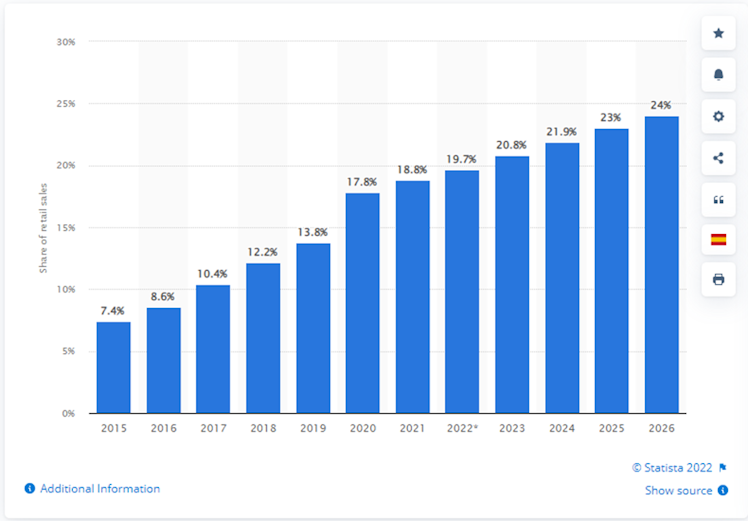
E-commerce is the driving vector of the rapid transformation in the payment sector and
especially the shift towards cashless transactions. Depending on sources and methodology, the share of e-commerce can vary anywhere from 14% to more than 20% and is expected to keep growing. Below is a chart representing e-commerce as percentage of total retail sales worldwide from 2015 to 2021, with forecasts from 2022 to 2026.
However, it exists many other vectors for growth in the payment industry such as digitization and digital wallet expansion for example. As a consequence, V’s TAM continues to grow.
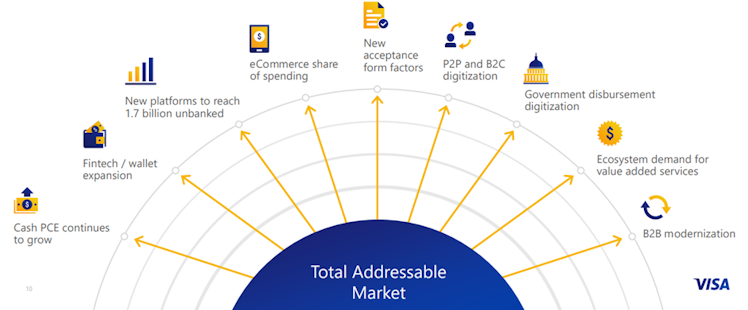
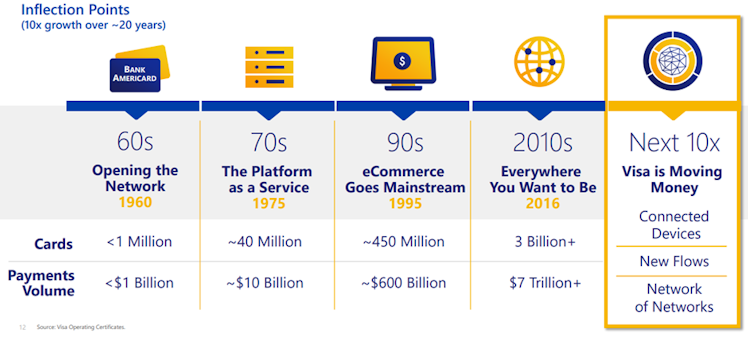
The above opportunities for growth, led by increasing share of ecommerce in global retail, raise V’s TAM to an impressive $185tn. According to the company, we are entering the fourth growth inflection in V’s 60+ years history and it is likely to offer a 10x growth over c.20 years, driven by opportunities in the connected devices, new flows, and network of networks.
Financials
- Income Statement
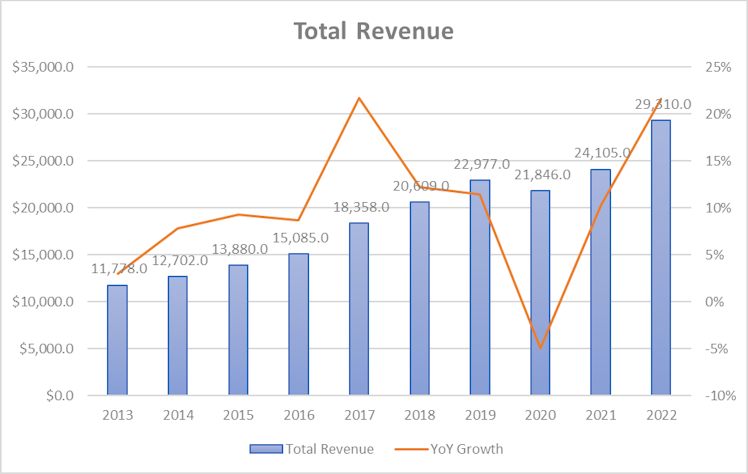
The company’s fiscal year ends on 30/09. V reported net revenues of $29.31bn, growing an average rate of 10% over the last decade. Revenue has been multiplied by 2.48 over the period representing a 9.55% CAGR. Revenue grew every year with the exception of 2020
where the Covid-19 and global lockdowns had a significant impact on the number of transactions processed.
Consensus expects total revenue to grow $10bn over the next three years, in line with historical CAGR. Below is the estimates revenue matrix.
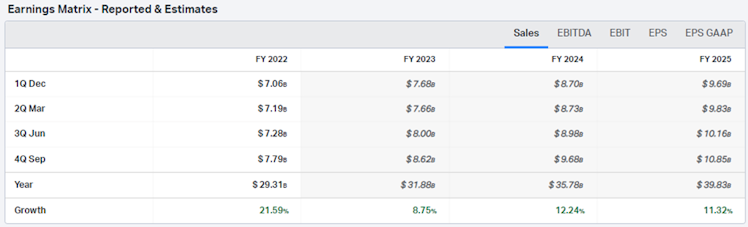
Source: koyfin
Based on V’s business model (% of a transaction), the company does not have any material cost of revenue and hence does not report gross profit.
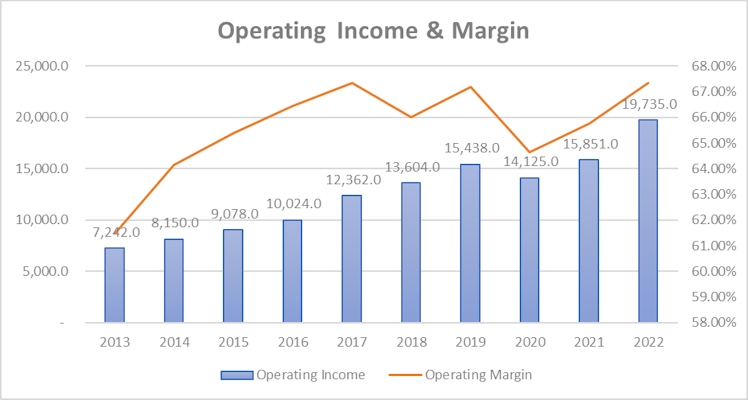
Looking at operating expenses, we can observe from the below table that they interestingly decreased as percentage of revenue while revenue grew c.10% per year during the period resulting naturally to an even more attractive margin profile for the company with operating income margin moving toward the high 60s.
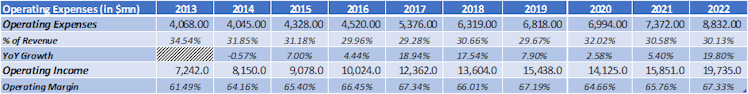
Few details on operating expenses were given on koyfin so we decided to analyze further in order to understand what makes them up.
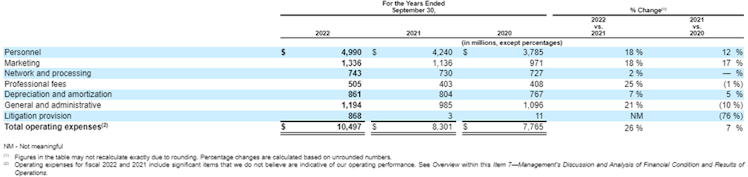
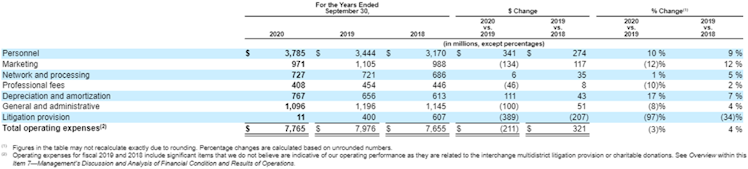
Source: Visa 10K 2022 & 2020 filings.
Personnel, marketing, and G&A make up c.70% of total operating expenses as of FY2022. It is worth noting that V is reporting network and processing fees, which mainly represent expenses for the operation of its processing network, including maintenance, equipment rental
and fees for other data processing services, as an operating expense and not as cost of revenue, which explains the (slight) discrepancy between koyfin and V’s numbers.
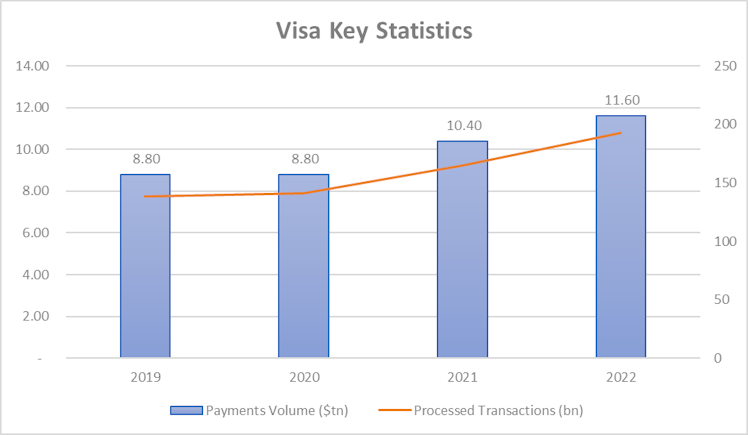
Focusing on this expense, it caught our attention to see that between 2019 and 2022, the company processed 54.2bn more transactions for an additional payments volume of $2.8tn however, network and processing fees only increased by $650mn over the period. In other words, it now cost less to V, as % of its revenue (only 2.5%), to process transactions implying strong scalability.
EBIT for FY2022 is $18.81bn and consensus expects it to increase faster than revenue, thanks to continuing margin improvements due to scale. Below is the estimates EBIT matrix.
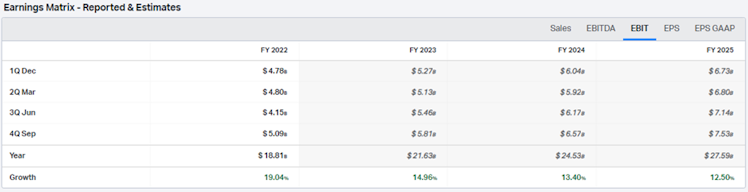
Source: koyfin
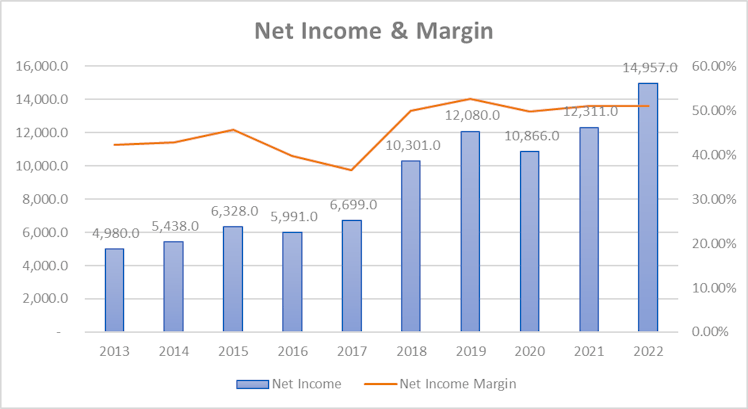
Net interest expenses have been historically low as a percentage of revenue (c.2% on average over the L3Y) and hence taxes is the main item deducted to EBIT in order to derive the net
income. The margin improvement observed at the operating profit level is directly translated in to V’s net income margin, which is now above 50%.
As a reminder revenue has been multiplied by 2.48 over the last 10 years but thanks to margin improvement and continued share count reduction (will be discussed in more detail in the next
section), EPS has been multiplied by 3.68x.
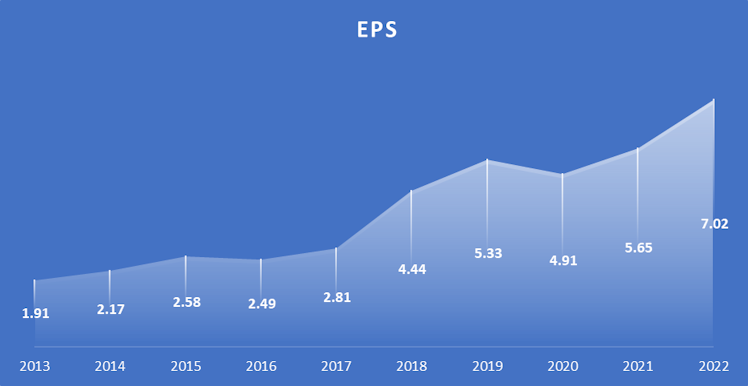
EPS is estimated to keep growing quickly and exceed $10 by 2025. Using FY2022 EPS and current stock price, it represents an earning yield of c.3.3%. The company distributes around 20% of its earnings to shareholders as a dividend.
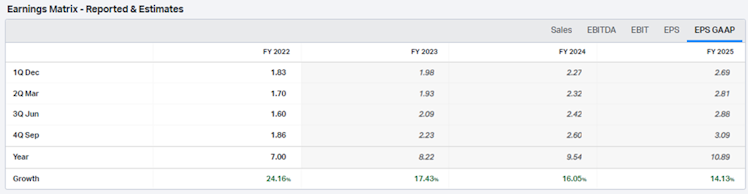
Source: koyfin
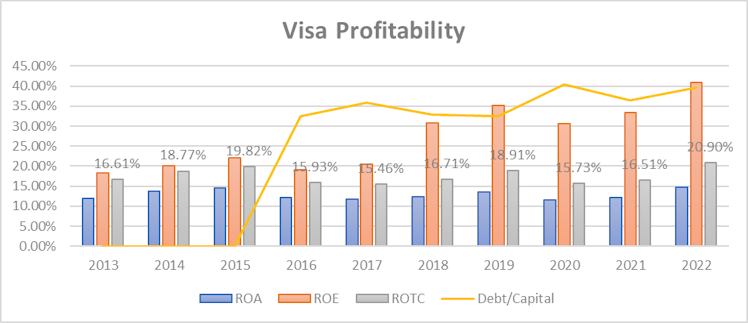
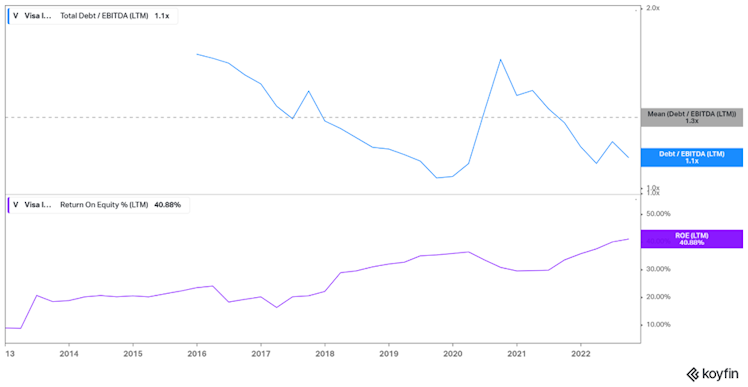
Return on assets (ROA) remained stable over the period and variated between 11-15%. However, return on equity (ROE) literally jumped from around 18% a decade ago to more than 40% last fiscal year. The ROE figure can be misleading as it does not take into account a company’s use of debt so we decided to plot ROA, ROE, and ROTC alongside V’s total debt on
capital. It is very clear that even if helped by margin improvements during the period, ROE trend was mainly pushed by increased (but reasonable) leverage. Using ROTC which accounts for capital structure, V’s profitability increased c.4%. Management decision to change capital structure will be discussed in more detail later.
Main competitors to V are Mastercard ($MA) and American Express ($AXP), below is a quick peers comparison:
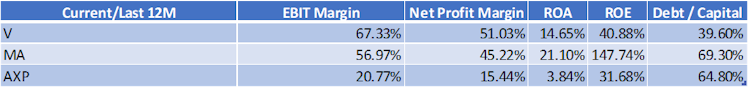
V exhibits higher operating and net income margins compared to MA, its closest competitor.
In terms of profitability, MA has an edge over V however with a significantly more leveraged balance sheet. AXP is lagging V in all metrics reported above despite having more recourse to debt.
- Balance Sheet
From a liquidity point of view, the company’s balance sheet is sound. Current ratio is c.1.5 and cash represents more than 50% of current assets. Logically the company does not hold inventory and the receivables are very limited. With a days of sales and payables outstanding
of 49.21 and 21.65 respectively, the company is able to collect cash relatively quickly (27.57 days) implying a liquid working capital position.
From a solvability perspective, as discussed earlier, V’s debt level is reasonable. Debt to equity and capital is 65.5% and 39.6% respectively. EBIT covers 36.7x interest expenses and current Altman Z-Score is 6.78, way above 3.
- Cash Flow Statement
Operating activities generated more than $18.8bn in cash in 2022 and increased in line with net income over the last 10 years. SBC added $602mn to CFO in 2022, representing only c.3% of the later. Historically, V’s use of SBC has been limited.
Investing activities used $4.3bn during the last exercise, mainly for purchases of marketable and equity securities. Cash acquisitions and capital expenditures are also significant and
key to V’s capital allocation strategy, which will be discussed later.
Financing activities used another $12.7bn in 2022 mainly due stock repurchase, followed by dividend payment and debt repayment.
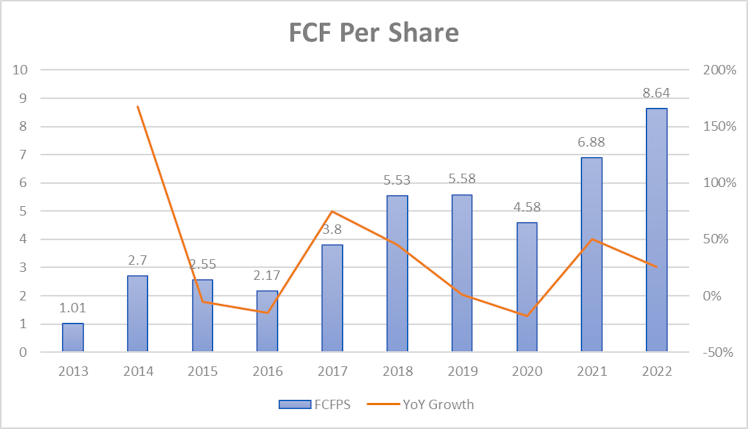
FCF was more than $17.8bn ($8.64/share) and given current stock price, it represents a FCF yield slightly above 4%. V is a strong FCF generator and grew the latter by more than 8x over the last decade, way faster than revenue.
Management and ESG considerations
V is such a big company that a detailed review of each executive CV would be tedious and no source of added value.
The management team is well structured and led by a team of individuals with world-class experience and skills in financial services and corporate management. These established professionals collaborate to drive V’s business forward through product and network
innovation, brand management, sales growth, operational activities and other means.
Alfred Kelly Jr. is the chairman and CEO of the company. He joined V in late 2016 after spending the majority of his career at American Express (23 years). Immediately prior to V, Mr. Kelly was president and CEO at Intersection, a technology and digital media company which
is an Alphabet-backed private company based in NYC. There is no doubt that Mr Kelly has extensive experience in this business, and also with regards to the technology transformation currently underway in the payments industry.
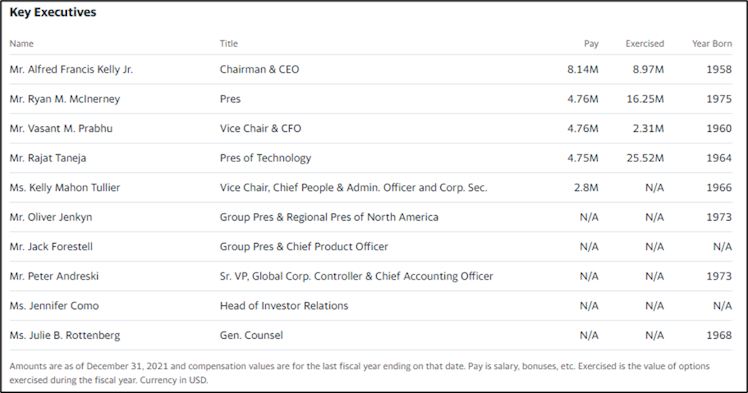
Source: Yahoo! Finance.
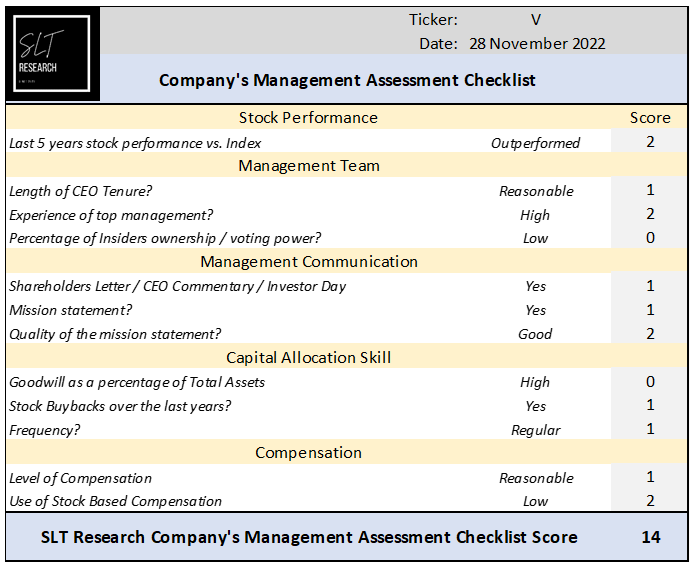
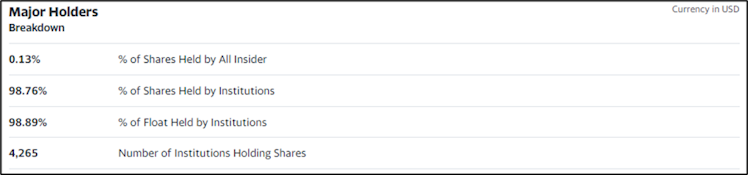
Based on the median value of CEO's compensation by company size (revenue), the current compensation appears reasonable. Only 0.13% of shares are held by insiders.
Source: Yahoo! Finance.
Communication to shareholders is qualitative and detailed – here is the last CEO shareholders letter in video.
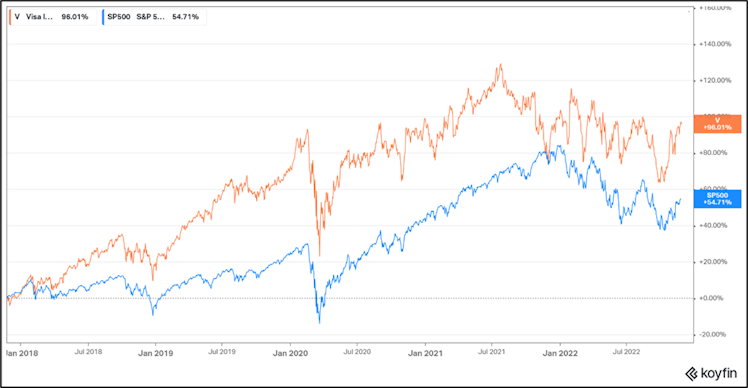
Over the last 5 years, V significantly outperformed the SP500 (in total return terms) by +41.3% (c.7.16% annualized outperformance).
We are convinced that shareholders value creation, in addition to the company’s moat and well executed operations, is attributable to a disciplined and well-defined approach to capital allocation.
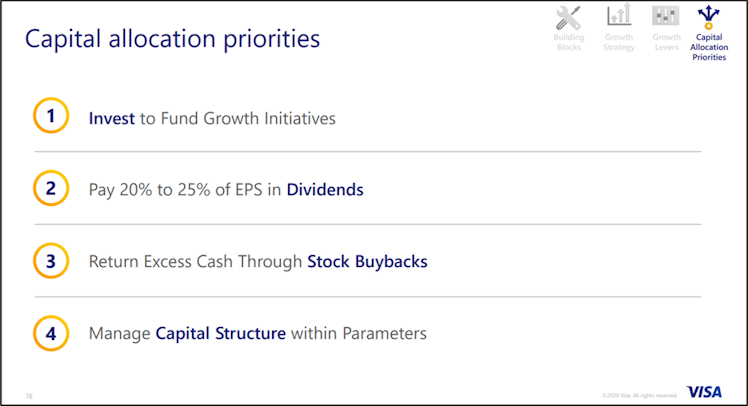
The first priority is to invest to fund growth initiatives and is twofold:
- Core capabilities: preference to build in-house (capex) over buying new companies (cash acquisition).
- Complementary capabilities: preference to partner instead of minority investment.
In a fast-evolving such as payments and money movements, it is important to stay ahead of the innovation curve and support future growth. We appreciate the favor to create/enhance products in-house even if the company is active on the M&A front (14 companies acquired, 8 in the last 5 years).
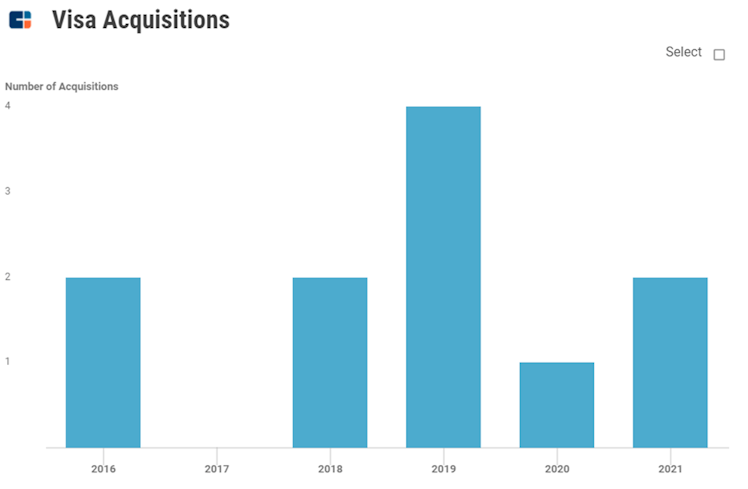
Source: CBInsights
Despite relatively high goodwill, V’s M&A strategy is pretty interesting and can be dubbed as a
“try before you buy” strategy. Mining V’s relationships data highlights a pattern of first partnering, as mentioned above regarding complementary capabilities, and then quickly moving to acquire soon thereafter when the company has a better view on the partner’s potential and potential synergies from an acquisition.
- 5 of 9 (56%) M&A deals kicked off with an earlier partnership.
- The median time between partnership to acquisition is just over 2 years. This suggests that V already has some degree of conviction on these companies before the partnership and the “try” period quickly serves to confirm this conviction and move it to buy.
In addition to invest to support V’s growth, the management is also focused on returning cash to shareholders through the payment of dividends and stock buybacks.
We can see in the table below, that over the last ten years, management delivered on the 2nd and 3rd capital allocation priorities. Payout ratio averaged 20.66% (lower end of the 20-25% announced in 2020) resulting in a DPS increasing every year and currently in its 13th year of consecutive increases.
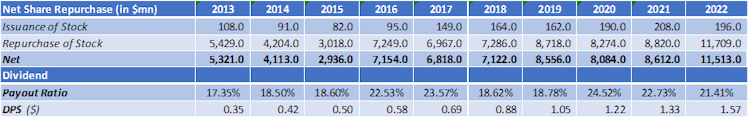
“Excess” cash has been deployed consistently to stock buybacks with a total of more than $70bn worth of shares repurchased over the last decade.
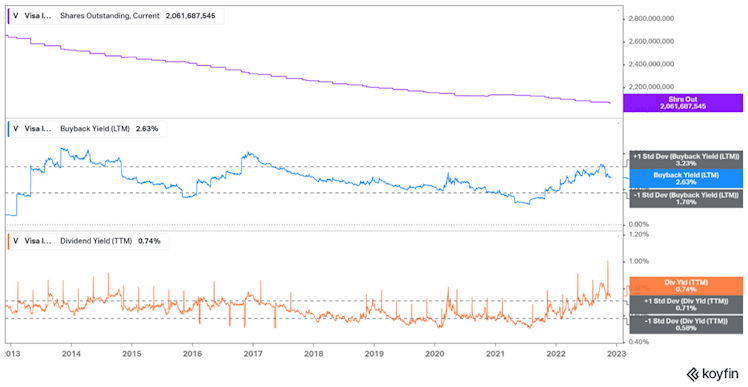
Logically, the number of shares outstanding gradually declined and the combined buyback and dividend yield, offer a shareholder’s yield historically above 3%.
To conclude, commitment to manage the capital structure within certain parameters and the inclusion to reasonable leverage through the use of debt, were smart decisions (especially
given the low cost of debt environment we experienced in the recent years). It allowed the company to enhance return on equity, reduce its tax burden, and maintain high credit ratings by the main agencies. Management has set out a target leverage of debt over EBITDA within
a range of 1.2-1.5x.
- ESG Considerations/ Glassdoor Review
The company has the desire to be a purpose-driven brand and is committed to building an inclusive economy and advancing economic opportunity for all. The companies run programs like digitally enabling 50mn small and micro businesses by 2023. Within V, management is also
keen to increase the number of underrepresented employees in the company’s workforce by 50% by 2025 and in the leadership by 2023.
The company represents limited ESG risks with a rating of B-, indicating good relative ESG performance and above average degree of transparency in reporting ESG data publicly.
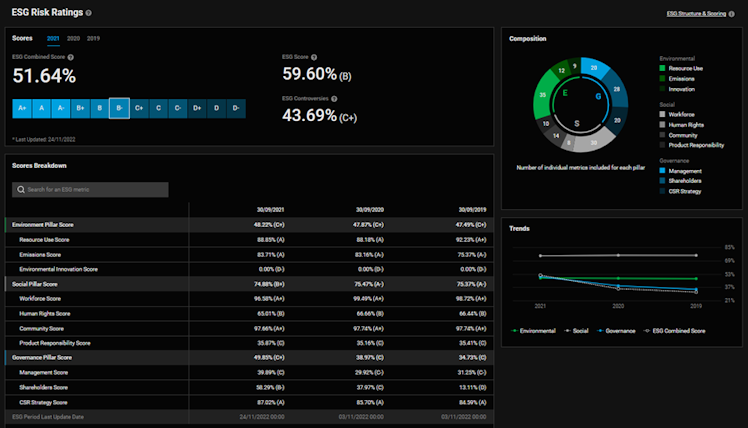
Source: DeGiro
V excels within the social pillar and it is confirmed by impressive Glassdoor reviews. Over 80% of employees who gave a review would recommend a friend to work at the company and over 90% approve of the CEO of V. Talent's retention in the fintech industry is crucial.
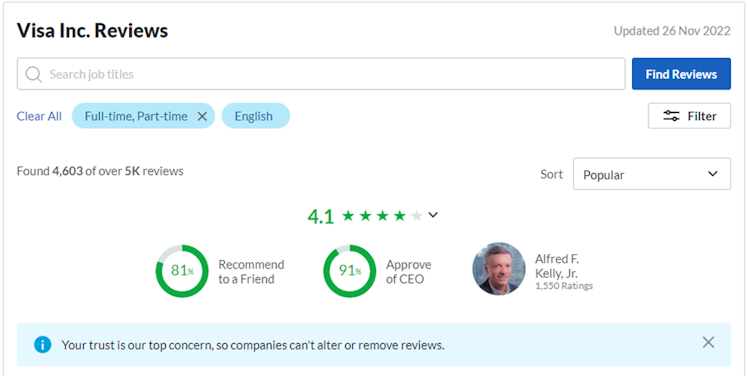
Source: Glassdoor
Valuation
As of 11/28/2022
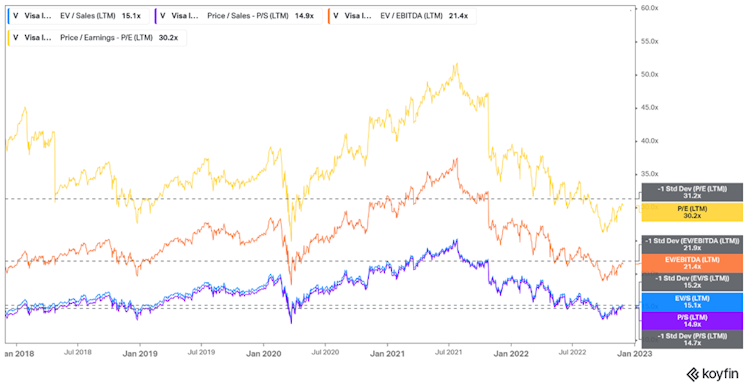
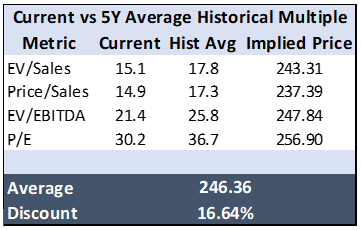
We are aware that comparing current valuation with historical multiples could be misleading however, it is worth highlighting that the company is trading below -1std of its 5Y historical main multiple averages. Even when compared with the most recent environment, the company was trading at higher multiples but we don’t believe the long-term thesis was different 6 months ago. V also trades at a discount vs. $MA.
Not to rely solely on absolute/relative multiples, we ran a DCF model to assess V's intrinsic value.
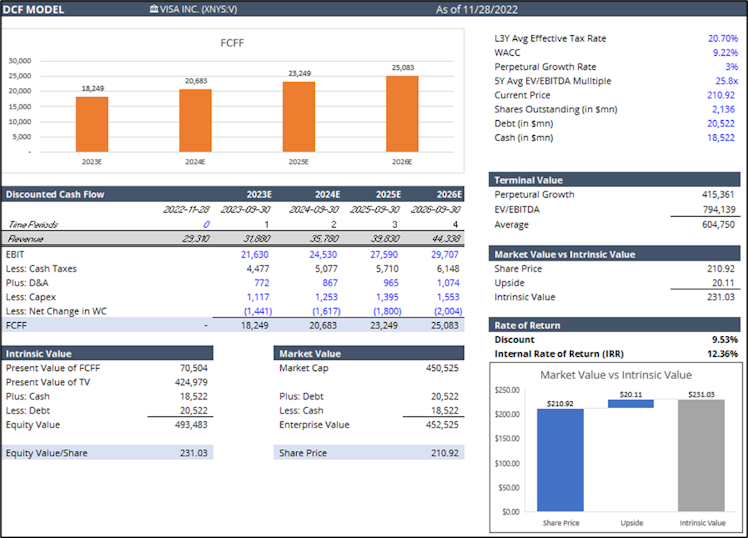
Our DCF model is also implying that shares of V are currently trading at a discount, but a smaller one – the assessed intrinsic value ($231) is above the current stock price (9.53%
premium) representing an interesting entry point, as our focus is to invest in quality growth names at a reasonable price. As an extra layer to our valuation process, we decided to cross check the above with a reverse DCF model.
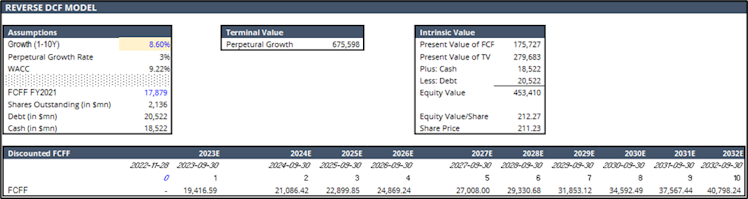
Based on the reverse DCF, current market price implies an FCF annual growth rate of c.8.6% for the next decade and 3% perpetually. Based on consensus estimates being more in the low tens and given the strong secular trend driving V’s industry, we believe one more time that V’s current valuation is reasonable.
Risks
Key risks for us include:
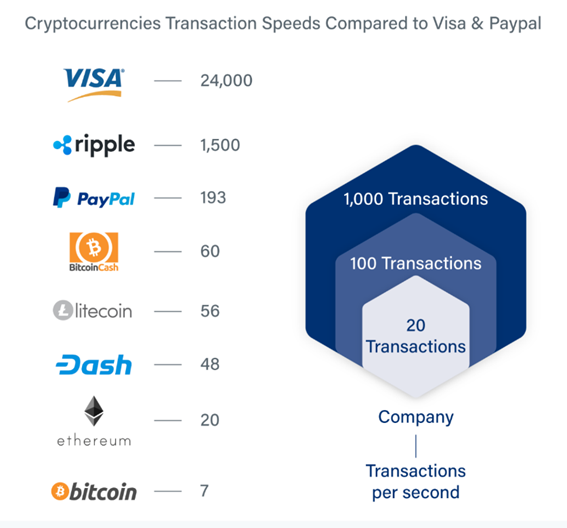
- Emergence of DeFI: Decentralized finance promises traditional financial products like loans and payment options without the high fees of banks and transaction processors. The real strength of blockchain technology is its trustlessness. The basis of the blockchain is decentralized over several thousand computers. There is no need to trust a single entity for the network to operate effectively. In theory, this eliminates trusted intermediaries who earn fees. V operates businesses that primarily consist of being that trusted intermediary. However, DeFi is still relatively new, and the recent crypto slump combined with the very low number of transactions processed on blockchain networks per second (see chart below) are obstacles.
- Regulatory risks: V is subject to complex and evolving global regulations that could harm its business and financial results. Increased scrutiny and regulation of the global payments industry, including with respect to interchange reimbursement fees, merchant discount rates, operating rules, risk management protocols and other related practices, could harm V’s business (e.g. regulations adopted by the Fed cap the maximum US debit interchange reimbursement rate received by large financial institutions).
Our aim is to provide you with accessible analysis but we truly believe we can all learn from each other, so please let us know your thoughts in a comment!
Disclaimer: The information provided in this post is for information only and solely on the basis that you will make your own investment decisions after having performed appropriate due diligence.
YouTube
Visa Annual Report 2021
In fiscal year 2021, we saw a shift away from the sheer uncertainty of the early pandemic toward a renewed focus on accelerating growth in a new and increasi...
Already have an account?