Trending Assets
Top investors this month
Trending Assets
Top investors this month
Has the market bottomed?
TL; DR - yes and if not we're very very close to it.
The market has been on an incredible uptrend this last week. The big question being, has the market bottomed or is this a temporary relief bounce?
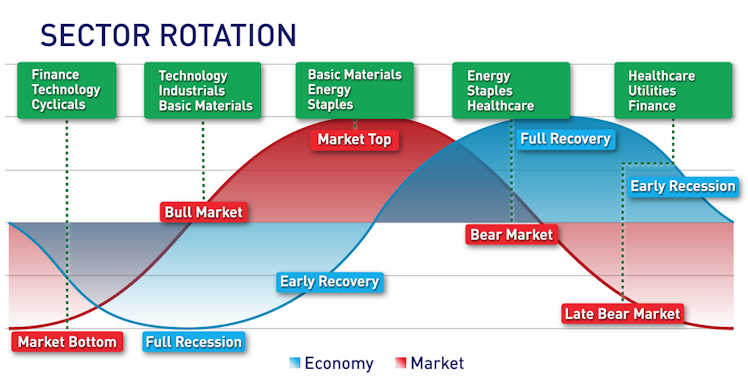
SECTOR ROTATION
In order to determine the market bottom you have to understand market structure and economic cycle. I won't try to get too advanced with this but this is a basic chart of how sectors rotate carry the market into bullish trends.
The most important thing to note in this chart is when you follow the red line, the market bottoms with "Finance, Technology, and Cyclicals."
Financials are always the first to bottom in the market. FINANCIALS always lead the way into a bull market. Tech soon follows.
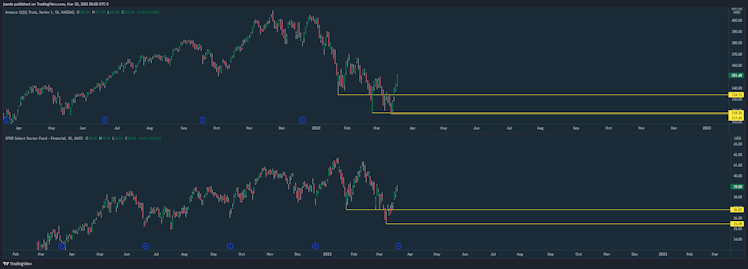
With this information we can use the NASDAQ ($QQQ) and compare it to the Finance Sector ($XLF). We use $QQQ over $XLK because it holds a lot more tech within it on top of being a stronger indicator of the market.
Here we can see on Jan. 24 we created bottoms on both $QQQ and $XLK. We continue further on in the chart and we see that a new bottom is formed on both once again.
Now this is where things get interesting. On March 14 $QQQ creates a new bottom, meanwhile $XLK breaks out of its downtrend. After seeing this I entered leaps on a lot of stocks which I will mention at the end of this article.
Like we had discovered earlier through economical cycle we know that FINANCIALS LEAD THE WAY. That is the #1 indicator the market has bottomed out.
COPPER BREAKOUT
Additionally we can also use $CPER as a leading indicator to the market rallying.
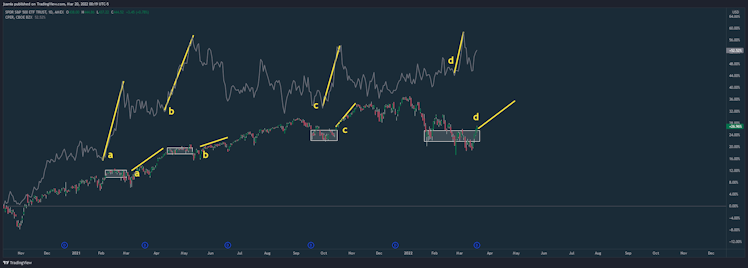
Every single time we see the market is in consolidation and we see the $CPER break out, its likely that its going to be followed by a bull run. $CPER is a leading indicator. Above are just a few examples of what I mean.
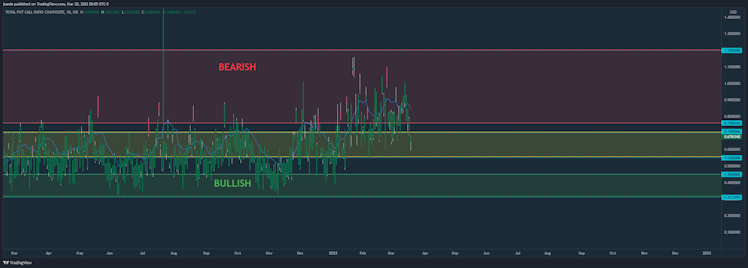
TOTAL PUT CALL RATIO COMPOSITE
The PC can be used to determine whether we are in a bearish or bullish market. While we don't have a clear indicator here of how market sentiment currently feels it appears that puts are decreasing. We've been playing on the high end and have been seeing lots of puts in the last 3 months. Hopefully we can confirm a bull market and shift over into the green-yellow side on my chart.
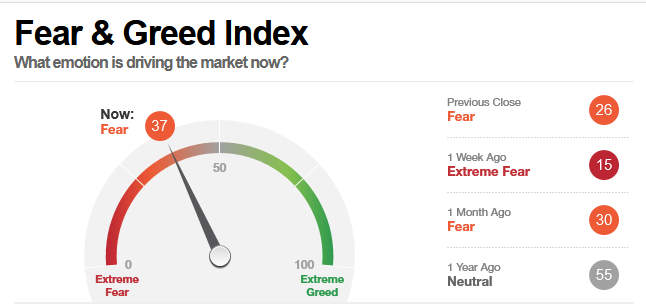
FEAR AND GREED INDEX
Just one week ago the market was under extreme fear. However it looks like investor sentiment is going back up. Especially with news FOMC news already being factored in and not hurting as many expected and Russia-Ukraine war not affecting us too heavily, it looks like we have investors ready to step back into the market.
Be greedy when others are fearful, and fearful and when others are greedy.
CONCLUSION
Yes I do believe the market has bottomed out based on these market structure indicators. However this does not mean we won't see pullbacks or retests. Please don't try to predict the market unless you have the capital to risk. **REACT** DON'T PREDICT. The market could very well see a retest. Personally I'm only invested in $QQQ and still waiting for my entry $SPY. I do expect the S&P to pull back once more, at which point I will position myself accordingly.
CURRENT POSITIONS:
$CPER 28c 07/15
$QQQ 375c 05/20
$IWM 220c 05/20
$XLV 140c 05/20
$XLF 42c 05/20
$AAPL 190c 06/17
I am in for about 30-40% of my intended position size on all of these and have been positioned since the proposed market bottom date I presented above. I am already up plenty so be careful of chasing. I plan to add slowly on dips over the next 15 days. I am also looking to enter $NVDA $AMD leaps. Possibly Bitcoin sentiment leaps as well.
Already have an account?