Trending Assets
Top investors this month
Trending Assets
Top investors this month
New Feature on Seeking Alpha
I just noticed this new tool that gives a quick overview and rating of portfolios/watchlists. I have about 30 watchlists on Seeking Alpha and it’s one of my top 3-5 sources of data. Their quant industry ranks are on point with all my other analysis so I know when I see a good quant rating, it’s quality data and I am looking at a strong company. I don’t read articles much anymore, mostly use it for the data & comparative analysis Bs industry peers and prior 5 years of performance.
This is just one more bit of data I can add to my pie. I like simplification. As I’ve developed my strategy over the last decade, I have moved to the Graham & Greenblatt approach. I analyze performance & valuation, buy list of excellent businesses at wonderful prices, and sell when they get back to fair value. (I’ll be sharing that performance soon to show how exceptionally it outperforms) So I love the simple overview 5 points scales & A-F grades, especially knowing there are dozens of data points going into each final ratio, rating, etc.
Here’s a shot of the overview of one of my watchlists:
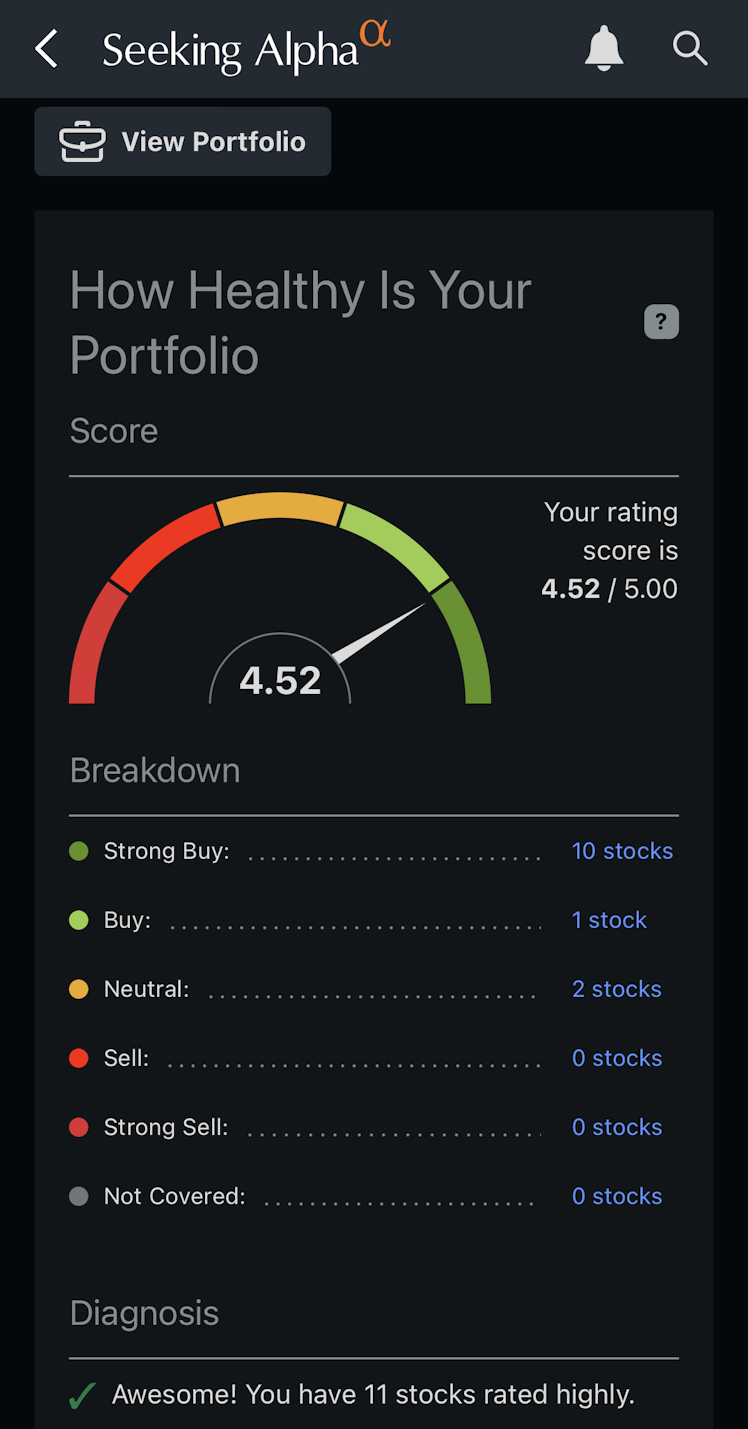
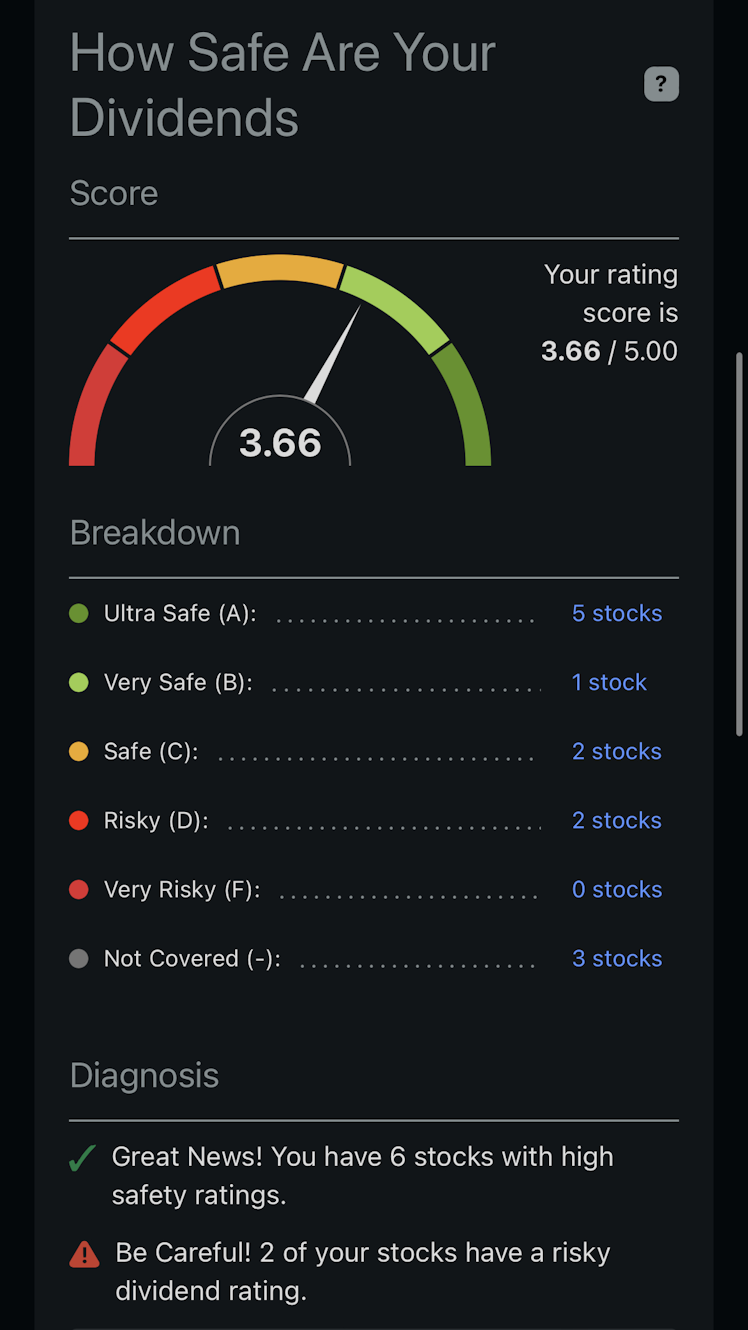
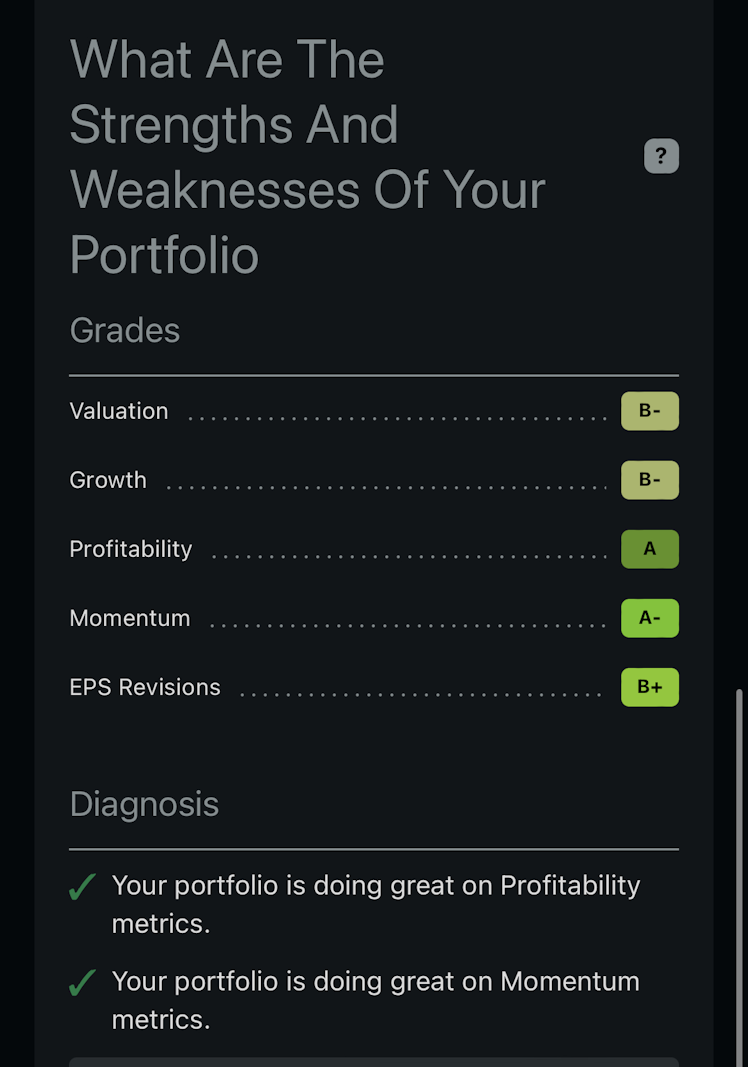
Source: Seeking Alpha
I personally ignore momentum & EPS revisions. Mostly irrelevant to my style. If I see negatives in the financials or questions at all, an investment goes straight to the “no thank you” pile, earnings shenanigans are culled out early in my analysis.
Already have an account?