Trending Assets
Top investors this month
Trending Assets
Top investors this month
Chart of the Day - high five
"Everybody outside
When I pull up outside all night, though
Everybody high five, everybody wanna smile
Everybody wanna lie, that’s nice, no
Oh, now you wanna chill? Oh, now you wanna build?
Oh, now you got the bill? That’s cool though" - Chance the Rapper
I couldn't do a rap/hip-hop thing this week without including something from Chicago's own Chance the Rapper.
Chance was clearly talking about everyone hangin' out and discussing the ISM data that came out yesterday it would seem to me. I mean, the tone sure seemed more upbeat than I would think.
Everybody wanna high five, everybody wanna smile because the new orders index ticked up a bit. That means we are close to a bottom right?
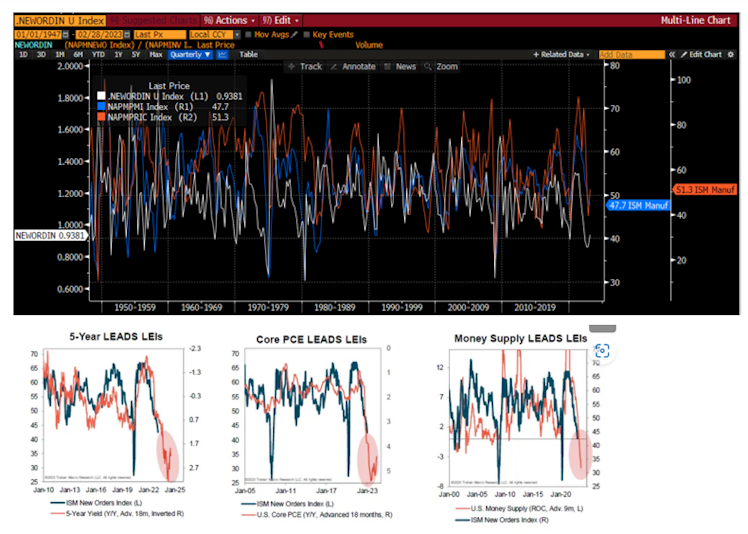
Maybe not. The top chart looks at the components of the data that came out. In blue is the headline index that fell to 47.7. It wasn't a steep fall but we are still below 50 and falling. Y'all remember that chart about what stocks do at a time like that?
The white line is new orders but it is the ratio of new orders to inventories. I think the ratio matters more because it gives a more full picture of the supply chain. One thing to see a slight up-tick in new orders. What is it doing in relation to inventories?
We can see that this measure did tick higher, albeit from one of the worst levels we have seen outside of a crisis. Up yes, wanna high five?
The orange line might be the most problematic. It is the prices paid index which moved back above 50. This means on average suppliers are raising prices.
Remember that gently falling inflation that was taking the Fed out of play? As Chance would say, oh, now you got the bill? That's cool though.
The bottom chart is one that I lifted from Francois Trahan, the ISM O.G. He showed this week 3 charts that he looks at that anticipate New Orders themselves. New orders anticipate ISM.
You can see that advanced 18 months or so, 5 year yields, core PCE and Money Supply all lead ISM New Orders. Funny how the cost of money and the cost of goods impact economic activity.
The charts are not sending a positive picture of where new orders are heading, which in turn doesn't send a positive picture of where ISM is heading nor where the SPX is heading.
Oh, now you wanna chill? Don't think so. Now you wanna build? Might be a little early to put that money to work. Probably want to wait for something sub 3500.
After all, the data is clearly showing stagflation. How do stocks and bonds do at a time like that?
Stay Vigilant
#markets #investing #stocks #economy2023

Already have an account?