Trending Assets
Top investors this month
Trending Assets
Top investors this month
Sell in May and Buy Outlier Stocks
I’m sure you’ve heard the Wall Street saying, Sell in May and go away. Turns out, there’s some truth to it.
However, like most things in life, that’s only half the story. The real saying should go like this, Sell in May and buy outlier stocks.

Seasonal weather patterns exist in our daily lives. Earth’s 4 seasons are fall, winter, spring, and summer. Summers are great for beaches, clogs, and laughter. Winter is dark, frigid, and often dreary.
Humans are accustomed to these cyclical shifts. Like clockwork, we plan our lives around them with our wardrobe and activities.
But what about the stock market? Should investors pull out the winter bear suits for May and beyond? Turns out, the answer is somewhat yes. In pre-presidential election years like 2023, there’s a tendency for stocks to underperform over the next 6-months and longer.
But here’s the rub. These drafty stretches for markets have sprung life into some of the best outlier stocks in recent history. Rainy markets are fertile grounds for institutional investors.
Yeah, you can sell in May and go away. You just may miss out on some of the biggest mega-trends under the surface.
Let’s rewind a bit. In November I presented a post mid-term election year playbook. Essentially, November – April of those years are uber bullish for stocks. Going back to 1980, those 6 months average a gain of +12.93% for the S&P 500.
That theme played out beautifully in this year’s cycle as November – April of 2023 saw the S&P 500 ramp 9.08%. Data is illuminating!
That was then. What about now? Should investors sell their stocks in May? One look at recent institutional action reveals the crowd has already started hitting the red button.
Below, our daily Big Money Stock Buys and Sells chart indicates a change in tone for May. We’re in the midst of a congestion zone for stocks:
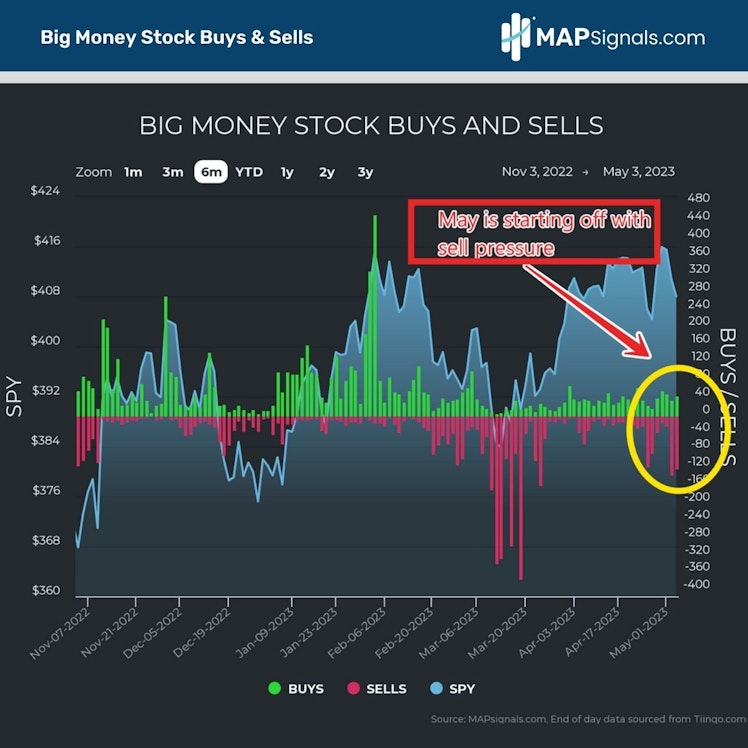
Risk-off action in oil prices and regional banks has the market spooked. But there’s a seasonal pattern to understand as well. May tends to lead off a seasonal downshift in stocks.
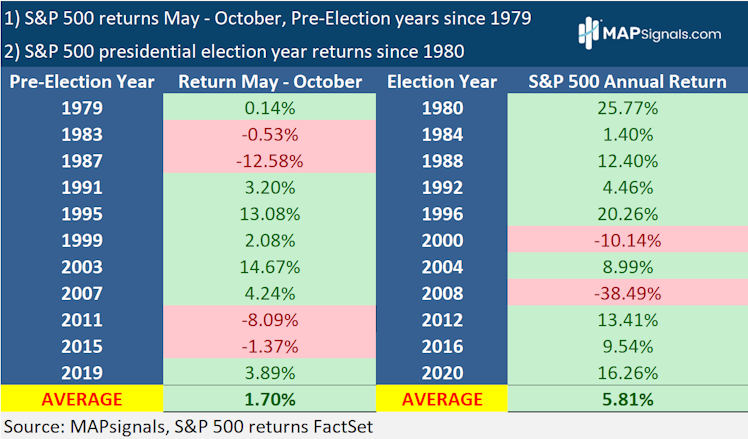
Check out this study. Going back to 1979, pre-election years tee off a rough patch in the months of May – October. Of the 11 prior instances, the average gain for the S&P 500 is a meager +1.7% in that half-year span.
For giggles, I also added the S&P 500 annual returns in each of the following presidential election years.
Unfortunately, those years have been lackluster too. The average gain for stocks is just 5.81%.
Take a look:
Looking at this table, selling in May could make sense. Afterall, market participants know the average annual return for stocks is 10% a year going back decades. Should we sit this period out?
NO!
Some of the biggest winning stocks in recent memory appeared during the treacherous months of May – October, in pre-election years.
Here’s a great example. Take high-growth semiconductor firm NVIDIA ($NVDA). It’s been one of the best growth stories in recent memory, and for good reason. The company has been growing sales and earnings at a breakneck clip.
In fiscal year 2023, NVIDIA had sales just shy of $27B and earnings per share of $3.43. This monster powerhouse started attracting significant institutional accumulation back in 2015. Uncovering unusual buy pressure is our specialty at MAPsignals.
Below plots every time NVDA was profiled on our weekly Top 20 report. Those blue bars include institutional support and healthy forward fundamentals. You’ll notice the stock practically lived on this report the past 8 years:
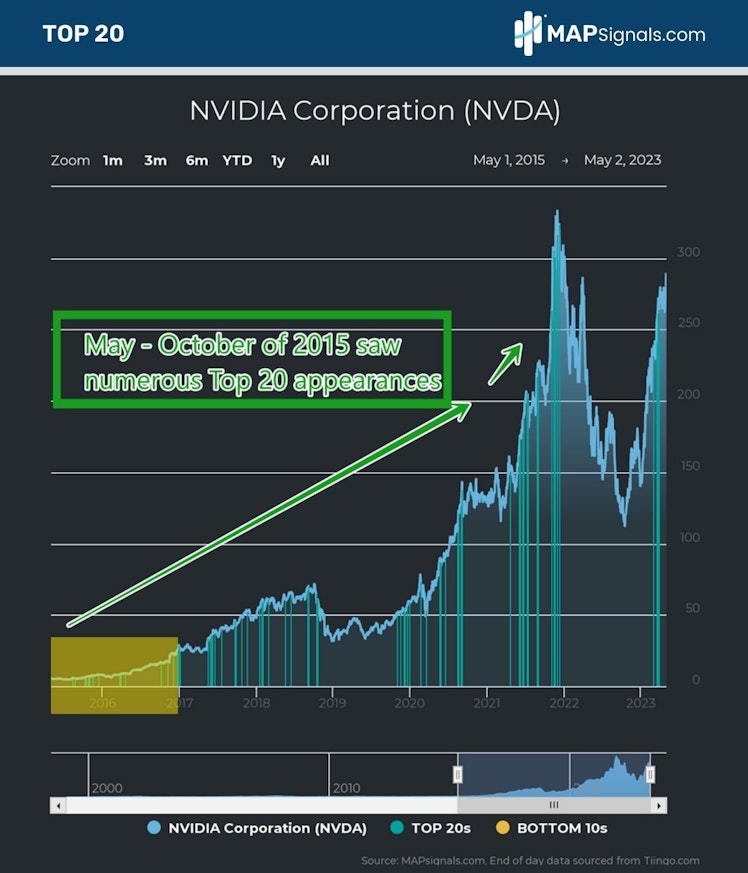
If you sold in May, you missed one of the biggest compounders of our generation. Split adjusted, NVDA traded with a $5 handle when it began its meteoric climb.
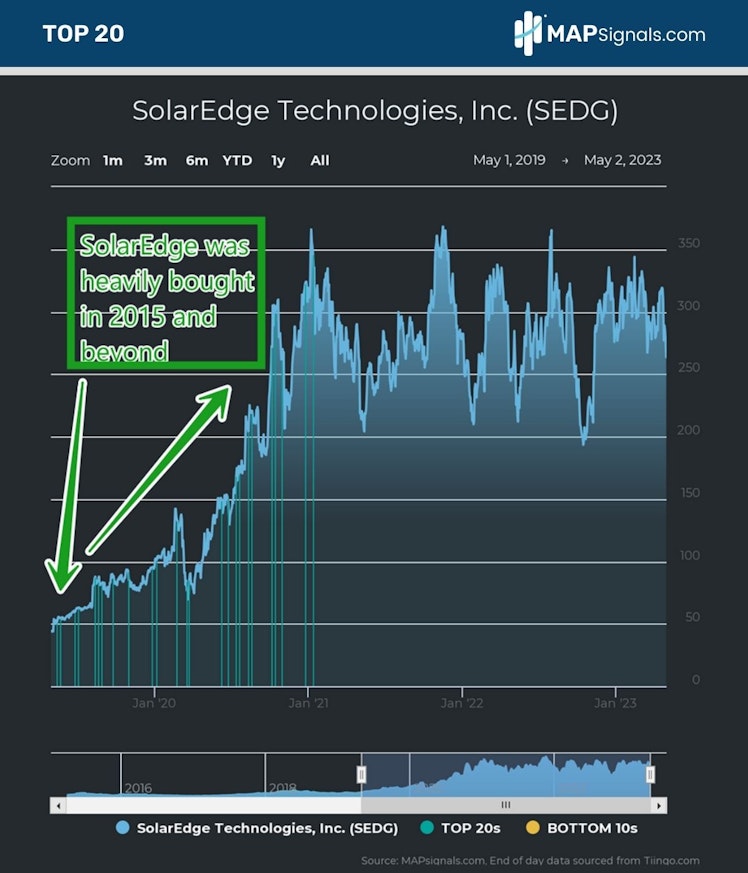
There are more examples. Here’s a great outlier name in our research from 2019. May – October saw heavy buying in SolarEdge Technologies ($SEDG). Like NVIDIA, the company sported healthy revenue and earnings growth.
In 2022, SEDG saw revenues balloon to $3.11B alongside $5.95 earning per share. Incredibly, the company has seen a 5Y sales CAGR of 38.6%.
With growth like that, you can bet institutions were supporting the stock. Look how often SEDG was profiled during the sell in May timeframe:
These 2 examples show why you want to keep turning over stones in your investing process. Playing the market is one thing, uncovering a game changing stock is another.
Sell in May and buy outlier stocks looks like the winning ticket to me. Let MAPsignals bring you these types of opportunities.
Many new names are making waves in our research this year. Now’s the season to hunt for the next crop of winners.
Follow the Big Money.
Here’s the bottom line: Sell in May and go away is rooted in fact. Since 1979, pre-presidential election years have seen bumpy performance for stocks in the months of May – October. Election years themselves are muted as well.
But keep on the hunt for best-of-breed stocks. When the crowd is bear-suited up, institutions are putting money to work.
Our research uncovered NVIDIA in 2015 and SolarEdge in 2019. Those are the types of stocks that can transform a portfolio…and institutional footprints are the guiding light.
Sell in May and buy outlier stocks!
Get a MAPsignals subscription today and let our algos bring you the next leading stocks.
Lastly, if you want some more positivity, our Big Money podcast is back. Listen as Jason and I break down recessions, earnings, and the 2023 market rally.
Have a great week!
YouTube
Recessions, Earnings, and the 2023 Stock Market Rally | Big Money Podcast
#recession2023 #JasonBodner #LucasDowney Investors are concerned about recessions, earnings, and the 2023 stock market rally. We break it all down with his...
Already have an account?