Trending Assets
Top investors this month
Trending Assets
Top investors this month
SLT Core Portfolio: Veeva Systems ($VEEV) - Q4 & FY2023 Earnings
Last week, Veeva Systems, a cloud-computing company that provides software solutions for the life sciences industry, and a stock we hold in our SLT Core Portfolio, reported its Q4 and FY 2023 earnings (FY ending January 31, 2023).
We covered the company in December last year. You can access the detailed analysis here.
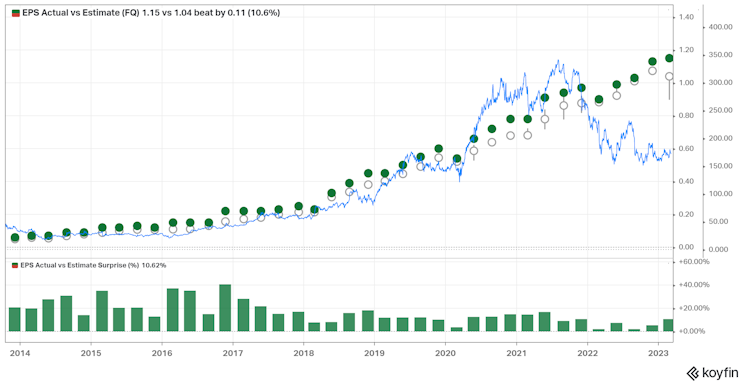
Total revenues for the Q4 quarter reached $563.4mn, up from $485.5mn one year ago, an increase of 16%. Subscription services revenues were $460.2 million (stable 82% of total revenues), up from $395.7 million a year ago. The company continued a 10Y long positive earnings surprise streak.
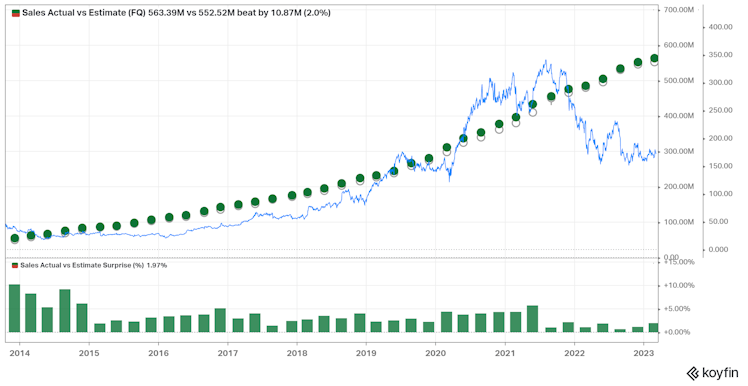
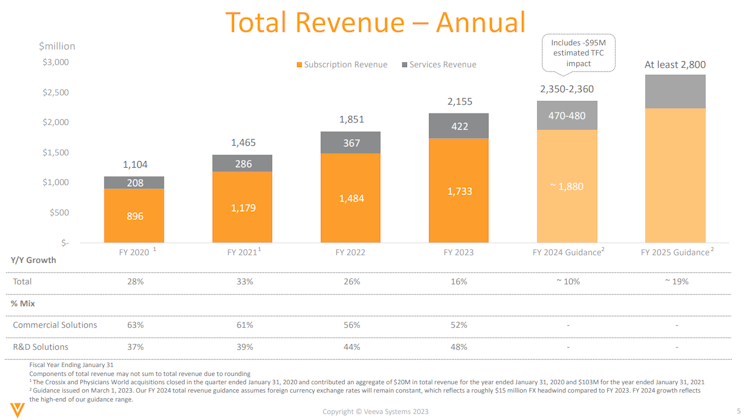
In the FY2023, total revenues amounted to $2.16bn, which is a 16% increase from $1.85bn in the previous year. The revenue generated from subscription services was 80% of FY total revenues.
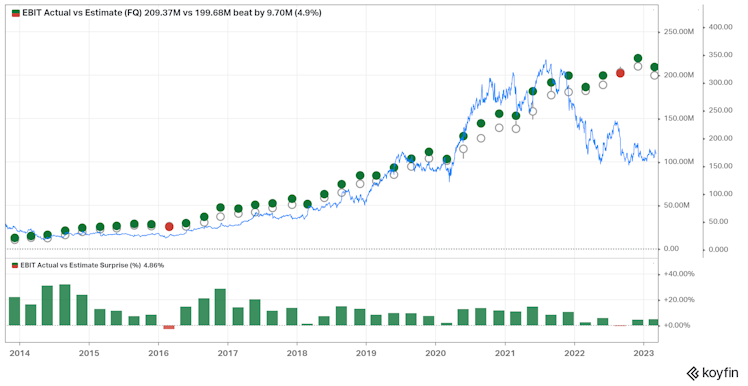
In terms of Operating Income, the company recorded a decrease in Q4 EBIT (but above consensus) from $119.7mn to $108.9mn, representing a YoY decline of 9%. On the other hand, non-GAAP operating income for the same period rose from $186.3mn to $209.4mn.
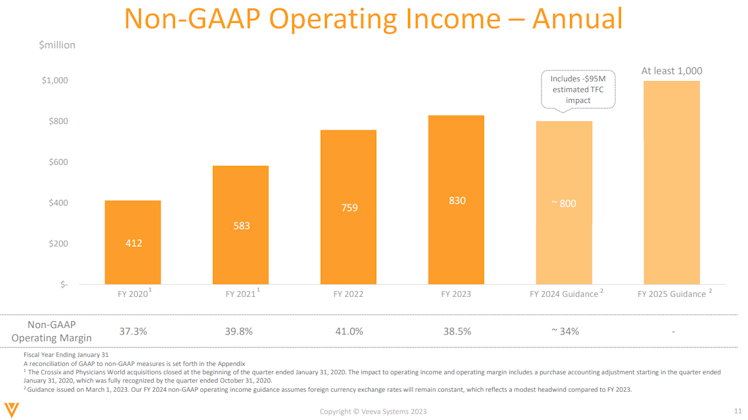
The operating income for FY2023 was $459.1m, which is a decline of 9% from $505.5mn the previous year. Non-GAAP operating income for fiscal year 2023 increased by 9% YoY to $830.5m from $758.7m one year ago. Non-GAAP operating margin contracted from 41% in FY2022 to 38.5%.
Regarding Net Income and Non-GAAP Net Income, the Q4 saw a significant YoY increase in the former, reaching $188.5mn compared to $97.1mn from one year prior, a 94% rise. Non-GAAP net income for the same period reached $186.3mn, up by 27% from $147mn one year ago. Over the last decade, the company never disappointed with regards to quarterly non-GAAP EPS.
FY 2023 saw a net income of $487.7mn, a 14% increase from $427.4mn one year ago. The non-GAAP net income for FY2023 was $695.6mn, which is a 15% increase from $604.7mn one year ago. EPS was $3, compared to $2.63 one year ago. On the other hand, the non-GAAP fully diluted net income per share was $4.28, compared to $3.73 one year ago.
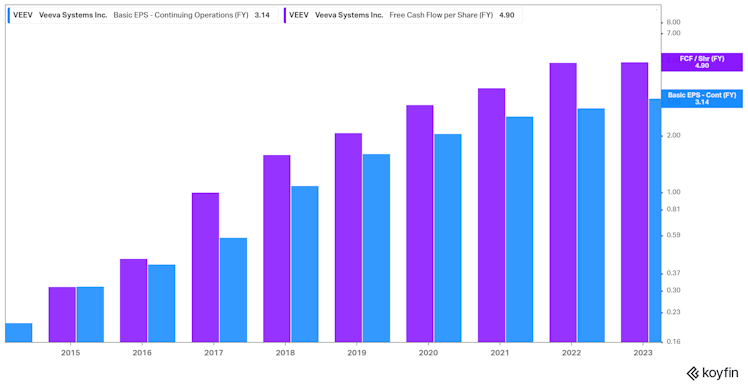
The company grew its FCFPS in line with EPS from continuing operations.
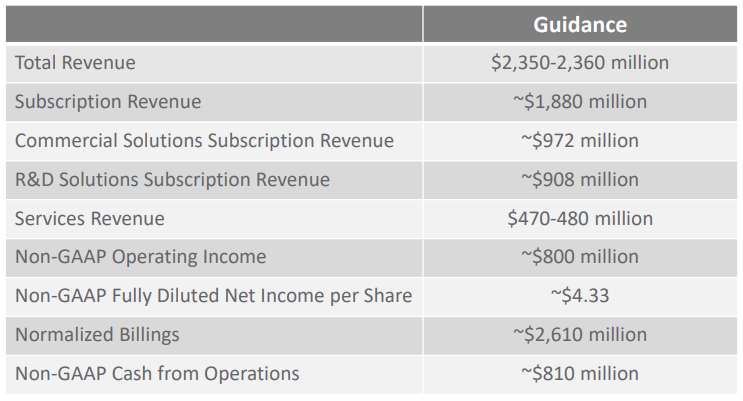
Management provided investors with guidance for the upcoming FY, including an average 9% revenue increase. Non-GAAP operating margin is expected to be around 34% and EPS relatively stable at $4.33.
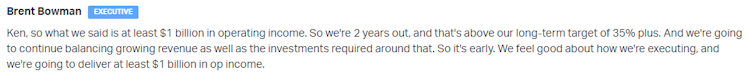
For FY2025, the management expects VEEV to reach at least $2.8bn in total revenues and $1bn in Non-GAAP operating income, implying a 35%+ margin. Below is Brent Bowman (CFO) comment on the operating income target:
Some highlights for the last FY is that VEEV expanded its partnership with the life sciences industry, finishing the year with 1,388 customers, up by 174 from the previous year. It also added three additional top 20 pharma in the Q4 for a total of six top 20 pharma committed to using Veeva Vault EDC for all new clinical trials.
Using our earnings transcript analysis tool, the ratio of positive words over negative is 2.39 and below are the main positive words.
To conclude, it highlights perfectly the long-term thinking orientation of the management and its continued strong execution. Our thesis remains unchanged.
Already have an account?