Trending Assets
Top investors this month
Trending Assets
Top investors this month
SLT Core Portfolio: Ulta Beauty ($ULTA) - Is Not It Beautiful?
As announced last week, after a brief introduction of the company (here), below is our latest deep-dive analysis of Ulta Beauty. Our aim is to provide you with accessible analysis but we truly believe we can all learn from each other, so please, as usual, let us know your feedback in a comment!
Thesis
- The beauty industry has shown resilience and sustainable growth over the years, driven by a growing consumer focus on self-care and wellness, and ULTA is well-positioned to benefit from these industry growth factors. Furthermore, the company's partnership with Target unlocks more growth potential.
- ULTA’s business model is differentiated and proven, offering a wide range of products across various categories, as well as salon services and an industry-leading loyalty program, constituting significant competitive advantages.
- The company has a strong balance sheet and financial performance, with consistent revenue growth, high gross margins, improved operating margins and robust cash flows. The company has a history of disciplined capital allocation to finance organic growth and has returned significant value to shareholders through share buybacks. Investment in the omnichannel offering and operational excellence could create further value.
- ULTA's experienced management team is well-equipped, and established a well-defined long term strategy, to extend its competitive advantages and gain market share, with a winning culture that fosters innovation and customer-centricity.
- In terms of valuation, both ULTA's historical multiples and a DCF model suggest that the company is trading at a reasonable valuation.
Sustainable Growth
ULTA operates in the beauty and personal care segment in the US. Over the last decade, the sector has been relatively stable and growing c.25% despite the Covid-19 pandemic which impacted revenue growth both in 2020 and 2021 as expressed by the below chart. According to Statista, the sector could surpass the $100bn revenue mark by 2027.
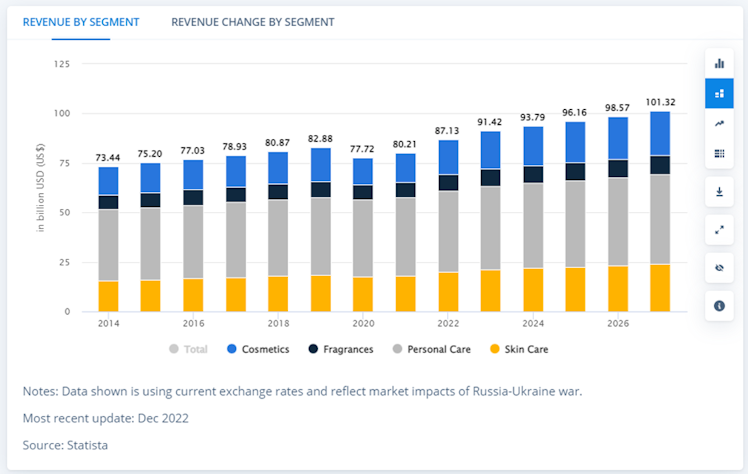
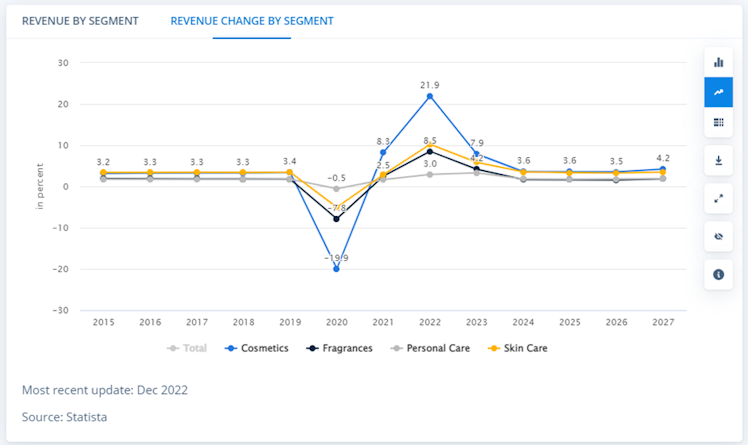
After 2027 and by 2030, Prescient & Strategic Intelligence expects US beauty and personal care market to represent $128.7bn, implying a 5% CAGR for the 2022-2030 period. Even if the most recent pandemic had a significant impact on consumers’ spending behavior, especially within the beauty industry, the below chart shows that affected products like cosmetics and fragrances recovered quickly following the end of restrictions and are set to grow at pre-pandemic rates for the forecasted period.
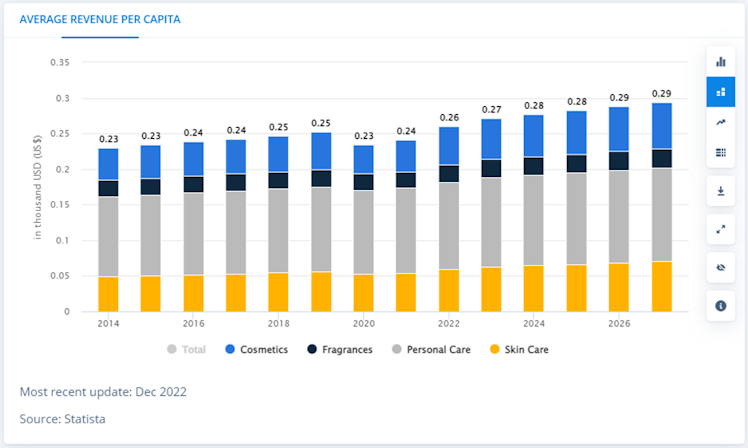
Average revenue per capita is logically expected to follow the same trend with average annual spending of $290, driven by cosmetics and skin care. Interestingly, these segments account for c.60% of ULTA’s revenue.
We decided to look at the beauty market driving factors and how ULTA is positioned to benefit from them.
- Influencers
Did you or a friend ever purchased a beauty product that was recommended by a beauty influencer? It's highly likely that the answer is yes, as around 65% of consumers have bought a cosmetic product after an influencer promoted it on social media. Influencers of all sizes, from micro-influencers to major names, can drive the industry's changes. They have a closer relationship with customers than most brands do, and a positive or negative review from them can have a significant impact. It has also proven itself to be a very efficient way for companies/brands to reach a large number of potential consumers at lower cost.
In contrast to its competitors, ULTA has adopted a distinct strategy for influencer marketing. Other brands have come under fire for collaborating with influencers who promote impractical beauty ideals, neglect to reveal paid content, and have lately been affected by the de-influencing phenomenon. In contrast, ULTA has prioritized endorsing authenticity and openness. Instead of depending on a handful of prominent influencers, the company has cultivated (often long-term) partnerships with a vast array of micro-influencers who represent various backgrounds. These influencers were selected based on their genuineness and aptitude to connect with consumers. As an indicator, ULTA is one of the most followed beauty brands (and the first beauty products retailer) on Instagram with more than 7m followers.
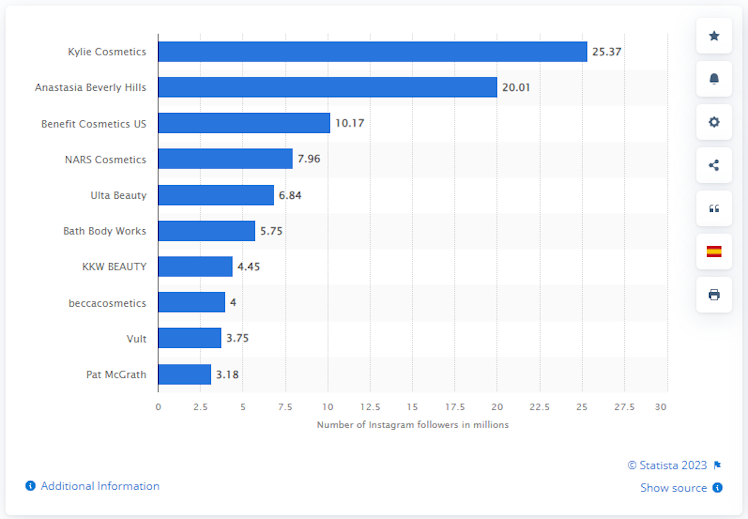
title: Leading beauty brands ranked by number of Instagram followers as of March 2022
- Online Shopping
In 2022, ecommerce sales for cosmetics and beauty retail in the US more than doubled compared to 2019, reaching $18.6bn from $9.21bn. Furthermore, by 2026, these ecommerce sales are predicted to make up almost one-third of the category's total retail sales. In terms of ecommerce sales, sephora.com leads the pack in the US with a revenue of $2.3bn in 2021, followed by ulta.com, which generated $1.89bn.
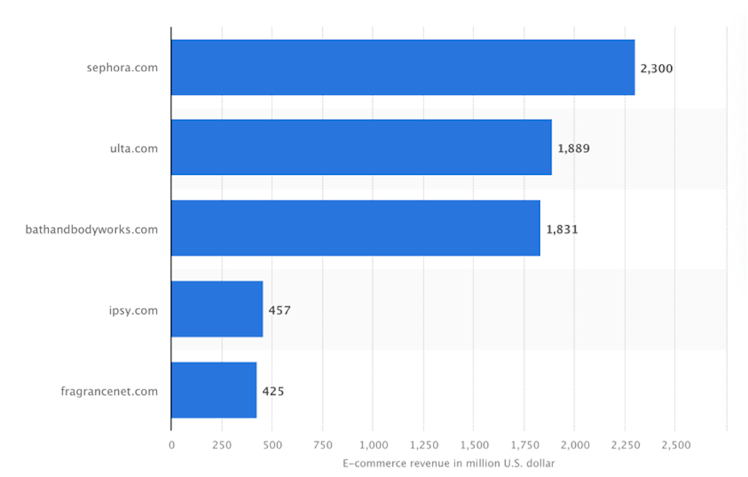
source: Statista
In the US, 22% of consumers prefer to purchase makeup, cosmetics, and fragrances online, while 34% opt for a combination of online and offline channels. Beauty brands that can adopt an omnichannel approach are more likely to attract and retain customers in the long term. To effectively merge online and in-store shopping experiences in 2023, beauty brands need to ensure
seamless integration across all channels. ULTA is focused on improving the digital experience it offers to consumers. The company's ecommerce sales grew by 35% CAGR from 2017 to 2021 (pushed by the pandemic).
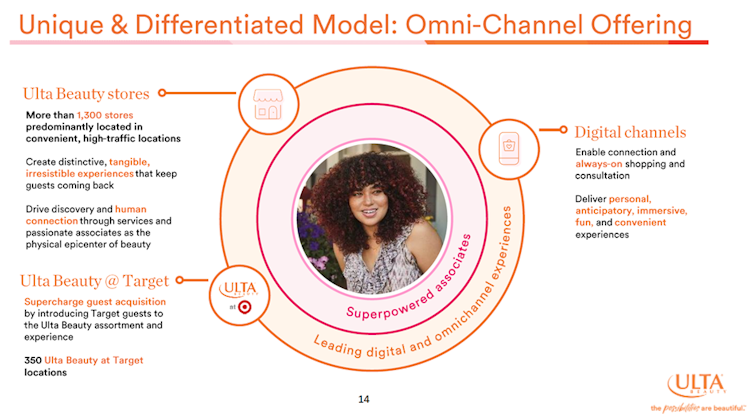
source: ULTA Investor Presentation (December 2022)
According to Karla Davis, ULTA’s VP of Marketing, an omnichannel strategy involves connecting all channels in a way that works behind the scenes to provide guests with a seamless and convenient experience wherever they need it. In addition to its online presence and conform to the omnichannel strategy, ULTA partnered in 2021 with Target to enhance the company’s footprint in the country and provide a “shop-in-shops” experience.
As requested by @tomato, for us, the partnership is highly valuable beyond the small revenue generated from royalties (less than 3%). The collaboration provides an opportunity for the company to increase loyalty members, which is a crucial driver of sales. Target has a much larger customer base, with over 90 million RedCard holders, more than double ULTA’s
loyalty members. Moreover, most of these customers have not been ULTA shoppers in the past. ULTA’s products are prominently displayed within a 1,000-square-foot section next to Target's beauty selection. Currently, ULTA is available in about 350 Target locations, and this number is expected to increase in the coming years, with plans to reach 800 locations in the long run. As the number of Target locations grows, it may help offset the temporary slowdown in standalone store openings this year.
- Gen Z
The beauty industry is currently experiencing significant disruptions mainly driven by the Gen Z's impact. This generation prioritizes self-expression and self-awareness, which is reflected in their beauty preferences. They are cautious about the brands they purchase from and the substances they put on their skin, thus they conduct thorough research before making a purchase decision. In fact, Gen Z spends more money on skincare than any previous generation.
ULTA accurately targets the “Beauty Enthusiast”, a customer who lives, loves, and breathes beauty and leans on to beauty for self-care and self-expression. Almost 80% of Gen Z female beauty buyers are considered "Beauty Enthusiasts" and account for 87% of beauty spend.
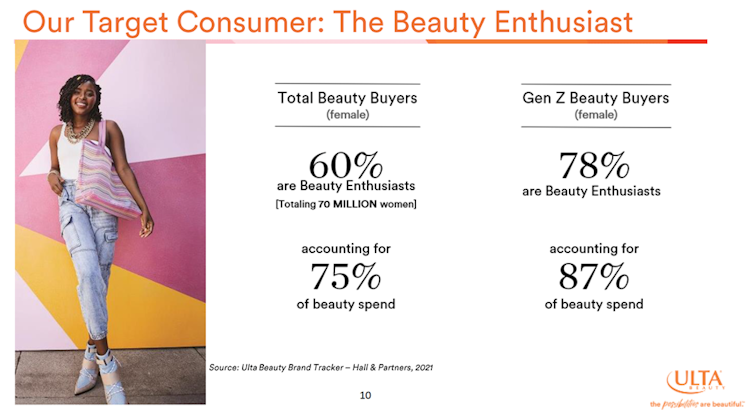
source: ULTA Investor Presentation (December 2022)
According to a survey carried out in the US in 2022 (Statista), ULTA was the leading beauty destination among US Gen Z consumers in that period, with a share of around 42% while Sephora ranked second, well below with a share of c.25%.
Competitive Moats
- One-of-a-kind Assortment: Democratization of Beauty
The company identified since its inception, an unmet need in the market by offering new shopping experiences for consumers beyond traditional mall or pharmacy/supermarket channels. They also stocked products across different price points, ranging from high-end brands to their own store-labels, bringing high and low under one roof. Today, ULTA offers a choice of 25k+ products across more than 600 brands.
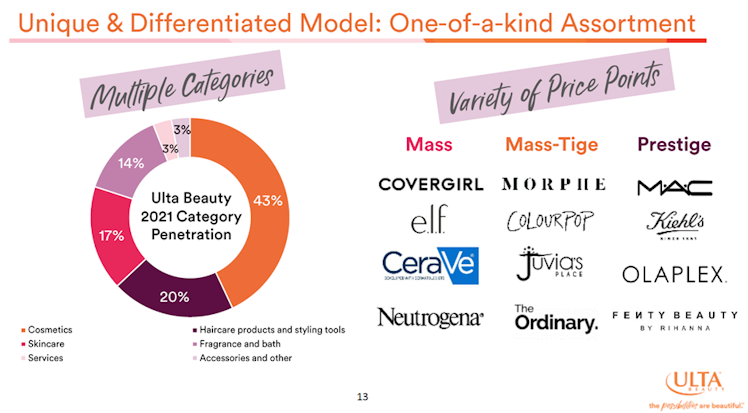
source: ULTA Investor Presentation (December 2022)
Notably, ULTA has been successful in utilizing this strategy to encourage its customers to spend more on prestige products over time. The company revealed that new customers generally shift from spending 100% on mass-market products to a 40% mass-market/60% prestige split over a five-year period. This is crucial because it builds customer loyalty, and prestige
products typically have higher profit margins than mass-market products.
- Services
The salon services (hair, skin, brows & wax, makeup & lashes, ear piercing) are also unique to the company because it allows the client to try products before purchasing them. ULTA relies on their different products and brands to draw customers in with how unique they all seem, which allows them to apply premium pricing for some of their products. As a result, the company could observe that services guests have on average 3x higher annual spend, that 50% of guests purchase retail products the day of a service and have 5 additional annual visits to ULTA stores compared to the classic ULTA guest. It is also a major source of customer’s loyalty increase.
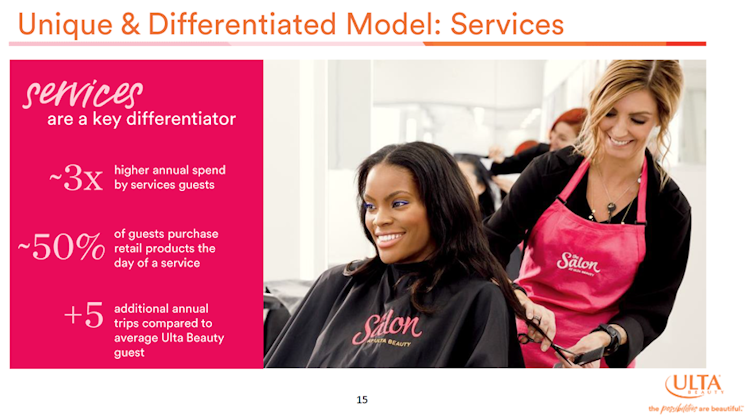
source: ULTA Investor Presentation (December 2022)
- Best-in-Class Loyalty Program
The company has developed a strong consumer research capability to comprehend shifts in consumer values, perceptions, and behaviors, as well as real-time insights. The company has a unique advantage with more than 40.2mm active Ultamate Rewards loyalty program members, which provides them with exclusive insights into customer preferences and behavior. Based on their insights, the company has identified that beauty enthusiasts have a profound and emotional connection with beauty, which is further enhanced by social media. Thanks to its Ultamate Rewards program, ULTA uses member data to enhance personalization and drive conversion.
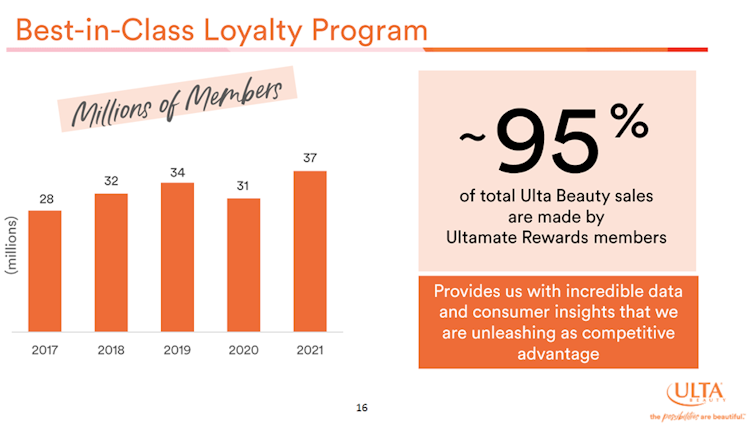
source: ULTA Investor Presentation (December 2022)
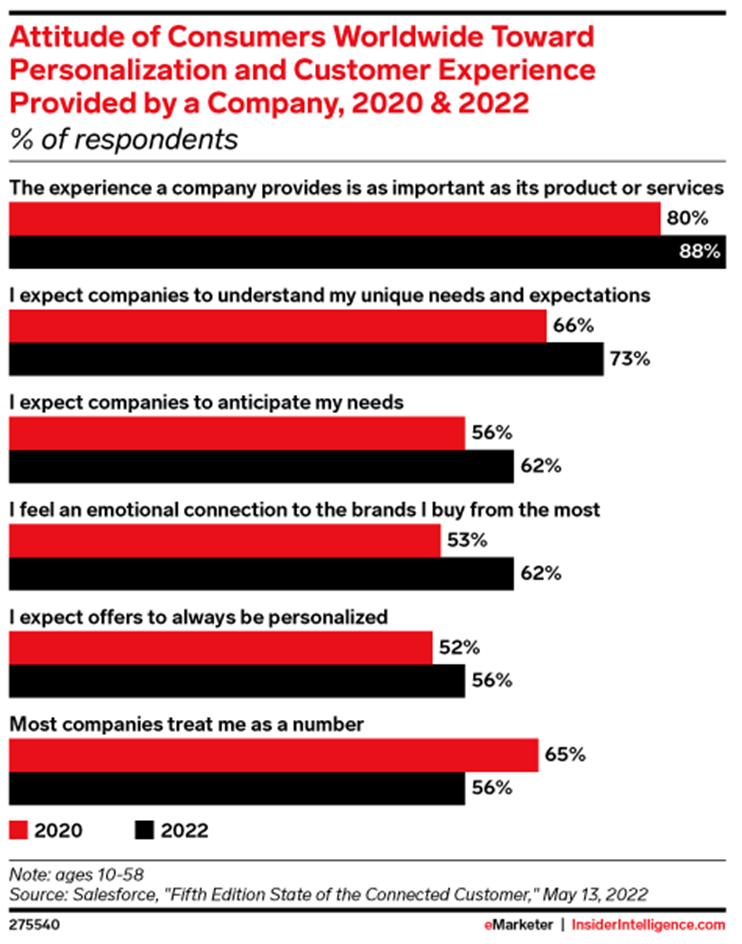
Personalization is an essential component of meeting customer expectations. McKinsey reports that 71% of customers anticipate personalized interactions, with 76% becoming frustrated when this does not happen. McKinsey’s research further highlights that personalization is linked to better customer outcomes, and companies that grow quickly earn 40% more of their revenue from personalization. Personalized recommendations can increase the likelihood of customer purchases by 75% in the beauty industry. Brands that fail to provide tailored experiences to customers risk losing out on revenue and customers. A recent survey by Optimizely found that 63% of consumers are more likely to shop with brands that customize the experience during the holidays. Understanding and anticipating customer needs is crucial, as 88% of shoppers believe that a brand's experience is as important as its products.
To conclude, ULTA’s current market share of 9-10% in the US beauty and personal-care market suggests that there is ample room for significant growth, especially as it expands its store network to cater to the convenience-driven consumer and attracts more loyal customers. Its extensive product range, diverse brand selection, rewards program, and well-trained staff
providing services are key strengths (competitive advantages) that set it apart from larger competitors, including mass merchants, department stores, and Amazon.
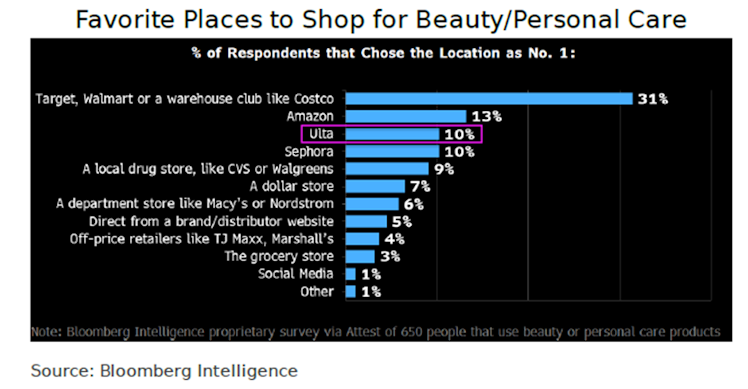
According to Bloomberg’s August and January surveys, ULTA is one of the top beauty shopping destinations. Those who shop at ULTA (about half of the total survey participants) tend to have a stronger affinity for trying new products and experimenting with bold colors. They also visit ULTA more frequently and spend more money per trip compared to other retailers. It is
important to also note that stores like Target (partner) rank number 1.
Financials
To avoid any confusion, please note that the financial year of the company ended on January 28, 2023 (fiscal year 2022 noted in 10K). Koyfin considers the most recent fiscal year to be FY2023, so please interpret any FY information from Koyfin as belonging to the previous calendar year (e.g FY2023 equals 2022).
- Income Statement
The below chart shows the total revenue for a company from 2013 to 2022, as well as the year-over-year (YoY) growth rates for each year. The company's total revenue increased from $2,670.6mn in 2013 to $10,208.6mn in 2022. The YoY growth rates ranged from a low of -16.84% in 2020 (pandemic) to a high of 40.30% in 2021, with an average YoY growth rate of 18.78% over the nine-year period. Revenue has been multiplied by 3.82 over the period representing a 16.07% CAGR.
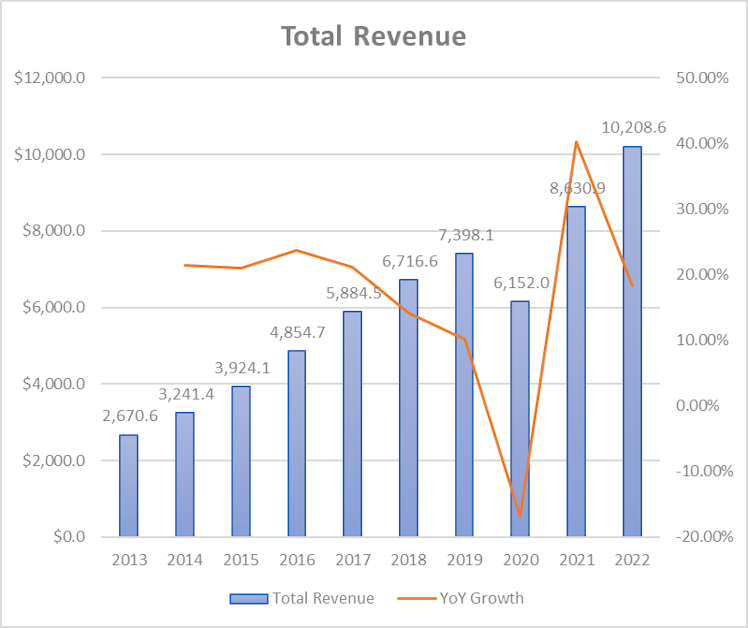
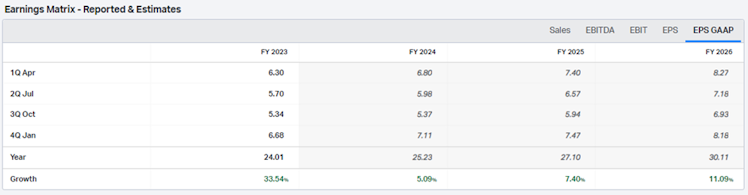
Consensus expects total revenue to increase by more than $2bn over the next three years, growing at a slower than historical pace, but above the beauty market growth rate. Below is the estimates revenue matrix. The company provided guidance for 2023 (FY2024, ending January 2024) with a revenue between $10.95-11.05bn, a more conservative range compared to Wall Street estimates.
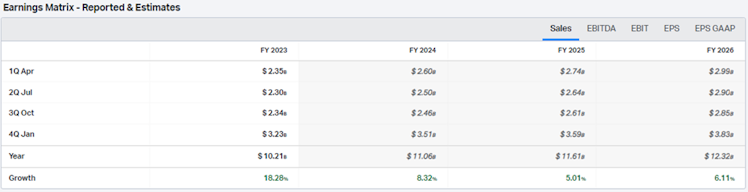
source: koyfin
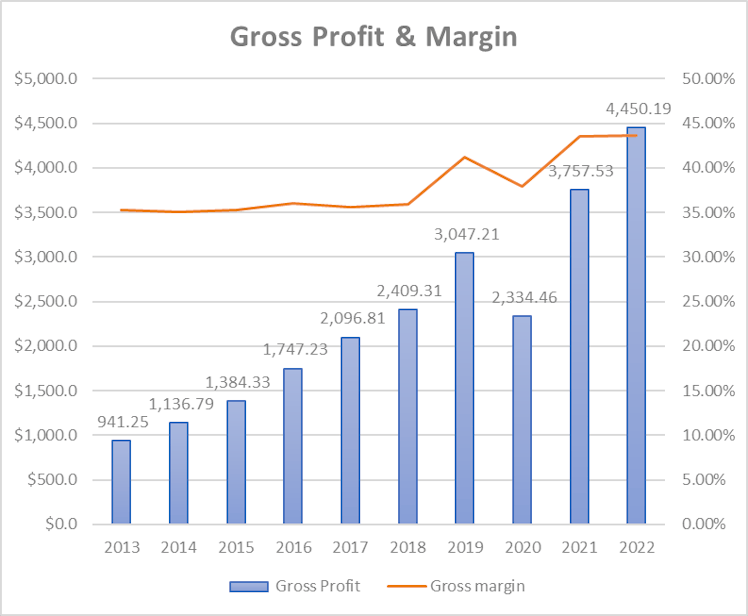
After a stable gross margin at around 35% pre-pandemic, the later improved to c.43% for the last 2 years. The main drivers for the gross margin improvement are the impact of occupancy cost optimization, royalty income from Target’s partnership, and a favorable channel mix (online sales).
Operating expenses are composed of SG&A and pre-opening expenses. Given the fact that the latter represent only an insignificant 0.1% of total revenue we will focus on SG&A.
The table below presents the operating expenses, operating income, and operating margin of the company from 2013 to 2022. The selling, general, and administrative (SG&A) expenses increased from $613.66mn in 2013 to $2,811.58mn in 2022. As a percentage of revenue, SG&A expenses increased from 22.98% in 2013 to 27.54% in 2022. In 2019, higher payroll and investment in future growth increased SG&A (as % of revenue) and this trend continued as the company faced headwinds caused by the pandemic.
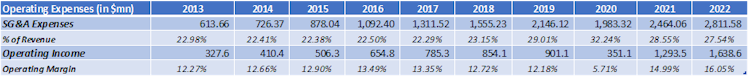
However, since 2020, we can note a reduction of SG&A (as % of revenue) of 470bps. The company's operating income increased from $327.6mn in 2013 to $1,638.6mn in 2022. ULTA's operating margin fluctuated over the years, ranging from a low of 5.71% in 2020 (impact of the pandemic), to a high of 16.05% in 2022. The company has been able to increase its operating income and operating margin, even with the increase in SG&A expenses, thanks to its gross margin improvement.
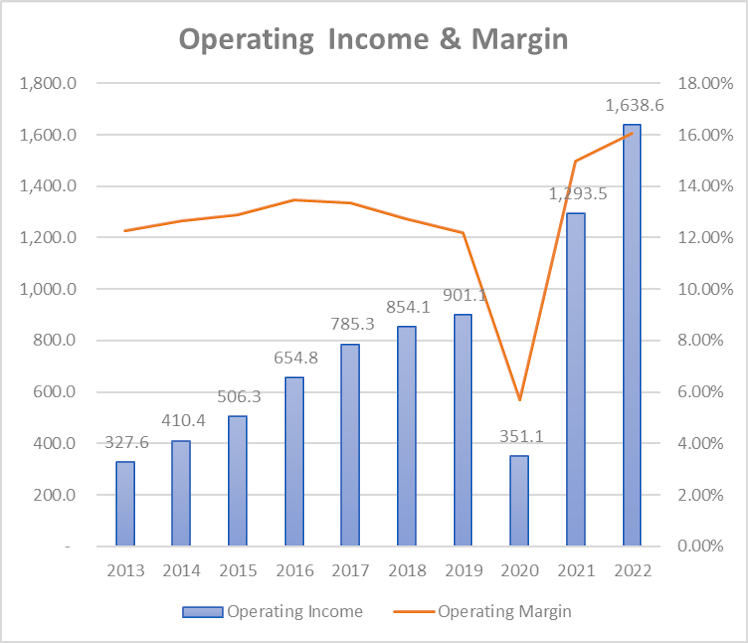
The company expects the operating margin to range between 14.7% and 15% next year. Below is the estimates EBIT matrix, implying an EBIT margin of c.15% for each of the next 3 years.
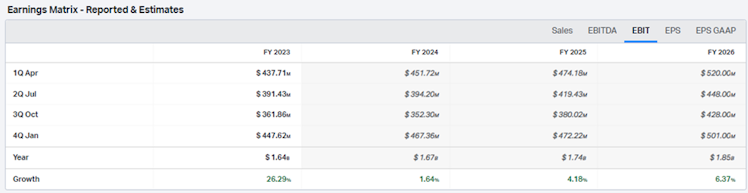
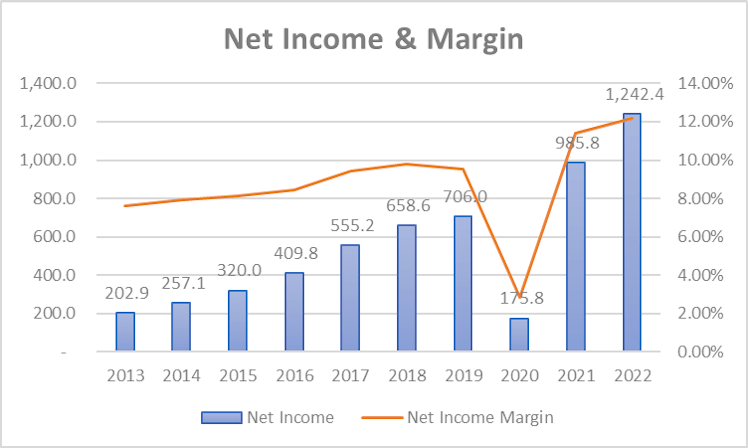
ULTA has currently no outstanding debt and hence does not incur interest expenses. The only other expense subtracted to the EBIT to derive the company’s net income is the income tax expense. 2022's tax rate was c.24.4% and as per the company’s guidance, is expected to be c.24.6% in 2023.
Net income finished the period 6.12 times higher, growing significantly faster than revenue thanks to the aforementioned margin’s improvement and also due to a more favorable effective
tax rate since 2018.
EPS grew even faster (7.62x) driven by significant shares outstanding number’s reduction. The share count reduced by c.12.6mn over the period covered.
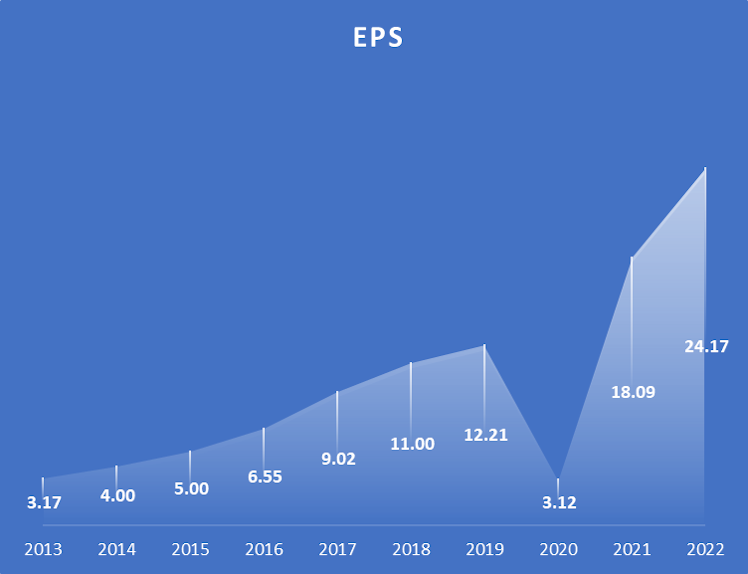
It is not a surprise to see consensus forecasting higher EPS growth than the one of ULTA’s revenue and EBIT. EPS is expected to surpass $30 by 2025 (koyfin FY2026). The company expects 2023 diluted EPS to be between $24.7 and $25.4.
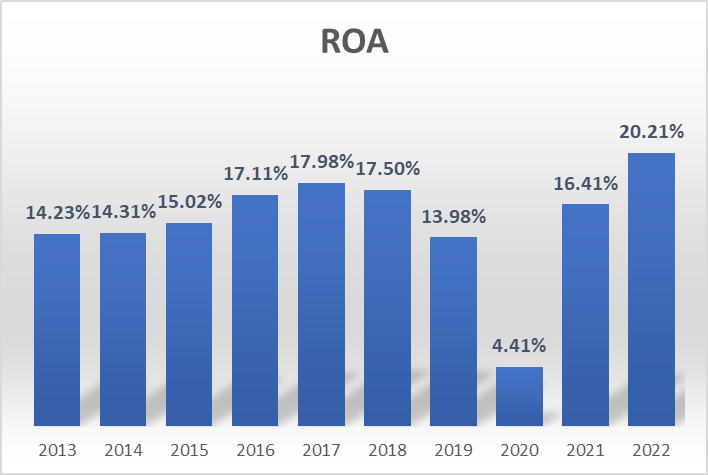
Better efficiency and margins are directly translated into a higher return on assets (ROA) at the end of the period. Excluding the Covid-19 period, the company globally posted a consistently
higher ROA over time, suggesting the company is efficient in using its assets to generate profits and is able to maintain its profitability over time. This could be a result of various factors, such as effective cost management (COGS), efficient asset utilization, and strong revenue growth.
ROE literally jumped over the period, from more than 20% in 2013 to surpass 70% in 2022.
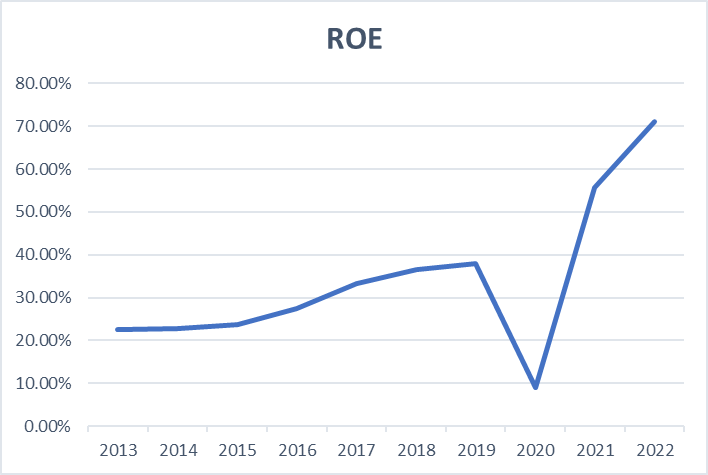
In order to better understand the above trend, we performed a DuPont Analysis for each of the covered years.

While net profit margin contributed (slightly) to the higher ROE, asset turnover remained stable over the period and it is effectively the equity multiplier that significantly increased from 1.6 in 2013 to 2.7 in 2022. It was caused by the introduction of long-term leases in 2019 (c.$1.6bn). As a result, common equity since stagnates around $1.9bn while total assets kept growing, increasing the equity multiplier and hence ROE.
Retail Industry Specific Metrics
Inventory turnover (measurement of the efficiency of inventory management): according to eposnow, an ideal inventory turnover ratio falls between 2 and 4, indicating good sales and business performance. A low ratio may suggest a decrease in product popularity or weak sales performance. On the other hand, an excessively high ratio can imply low stock levels and missed sales opportunities. ULTA’s inventory turnover ranged between 3.1x and 4.2x over the last decade.
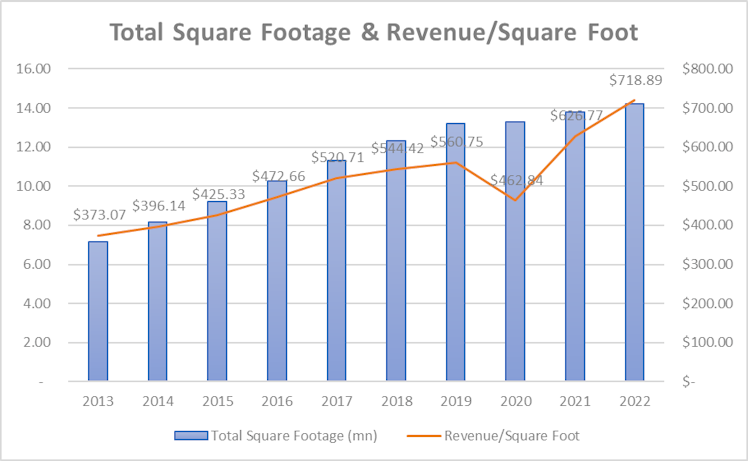
Revenue per square foot: this metric measures a company's revenue generated per unit of retail space. It is a useful metric to evaluate the effectiveness of a company's retail space utilization and its overall financial performance. A higher revenue per square foot figure indicates that the company is generating more revenue from each unit of its retail space, which can imply efficient use of the retail space, high customer traffic, and better sales performance. As exhibited in the chart below, in addition to approximately doubling its total square footage over the period, ULTA also multiplied by 2 its revenue per square foot.
- Balance Sheet
From a liquidity point of view the company meets our criteria. Current ratio is more than 1.6, with inventory accounting for the majority of current assets. ULTA holds more than $730mn in cash.
Days of Inventory Outstanding are 98.1 and because ULTA collects payments from sales (7.7) quicker than it pays its suppliers (34.5), the cash conversion cycle is around 70 days. The average cash conversion cycle for a retail company is 79 to 87 days, hence it is positive to see that ULTA is able to convert cash quicker than the industry average.
From a solvability point of view, and as discussed earlier, ULTA’s debt level is non-existent and has a strong balance sheet. However, if we include long-term leases in the total amount of debt, debt to equity and capital are 97.1% and 41.9% respectively. Net Debt (cash minus long term leases) only represents 0.5x the company’s EBITDA and with a current Altman Z-Score of 7.14 (above 3), it is fair to assume that there is no risk of bankruptcy.
- Cash Flow Statement
Operating activities generated close to $1.5bn in cash in 2022. D&A represented on average c.4% of revenue over the past 10 years and has been historically the main addition to net income in order to compute the cash from operations. Other operating activities also increased CFO in the recent years, unfortunately we have not been able to collect more details on the nature of these other operating activities.
Investing activities used $314.58mn during the last exercise, almost entirely attributed to capital expenditure (CapEx). The latter accounted for c.8% of ULTA revenue between 2013 and 2017 to finance the company’s massive organic growth and expansion. It gradually declined to 3-4% of total revenues, as new store openings have slowed.
Financing activities used another $861.01mn in 2022 used entirely to repurchase common stocks. Net repurchase of common stock totaled $907.02mn in 2022. ULTA repurchased stocks during each of the covered year, and issued debt only in 2020, fully repaid by the end of the same year. The company does not pay dividends.
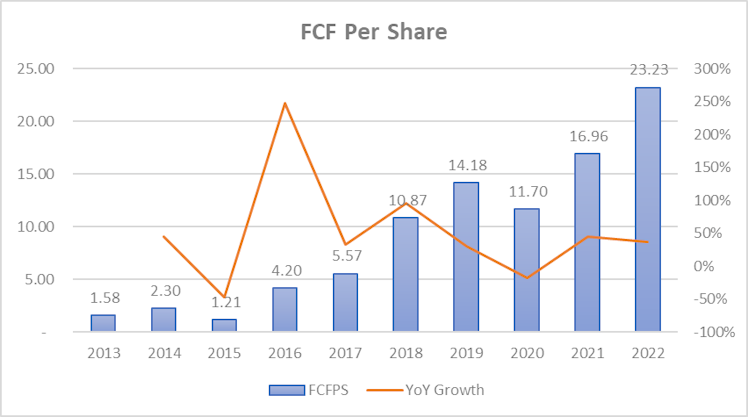
FCF topped $1.17bn last fiscal year ($23.23/share). Historically, the company showed a strong FCF generation and thanks to the self-financing of its growth, lower capital expenditure requirements toward the end of the period, and constant shares count reduction, ULTA multiplied its FCFPS by 14.7x over the past decade. Given current stock price and FCFPS, it
represents a FCF yield of c.4.26%.
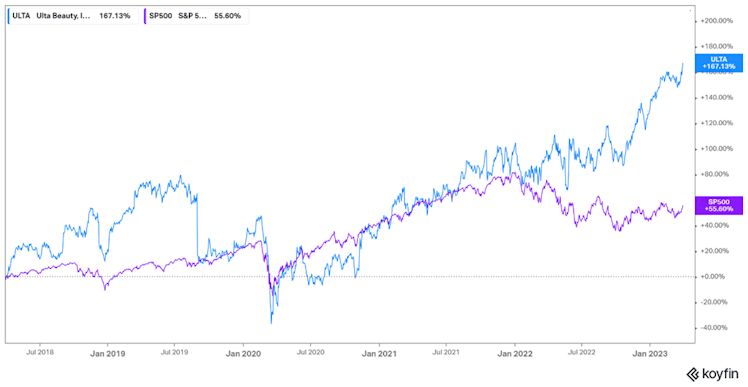
Management & ESG Considerations
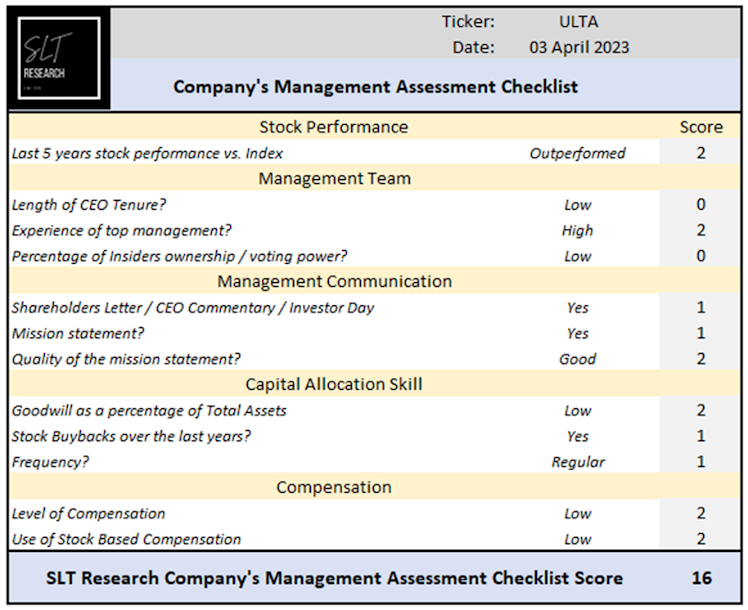
Over the last 5 years, the stock outperformed the S&P500 (total return) by +111.53%.
The company is led by David Kimbell, who has extensive experience in various positions related to marketing, merchandising, and executive leadership. He has served as Chief Marketing
Officer and Executive Vice President at U.S. Cellular, Chief Marketing Officer and Senior Vice President at Seventh Generation, and held various positions at PepsiCo and The Procter and Gamble Company. He has been with ULTA since 2014 and has held several roles, including Chief Merchandising and Marketing Officer, and President before becoming CEO in June 2021.
Given his diverse experience in the beauty industry and consumer goods sector, it is fair to assume that Dave is well prepared for his current role as CEO.
David is surrounded by an experienced an well-structured management team. Scott Settersten has a long tenure with ULTA, joining in 2005 as a Director of Financial Reporting and currently serving as CFO, Treasurer, and Assistant Secretary. He focuses on optimizing the company's store fleet and before joining the company, Scott worked for 15 years at PwC. Another key member of the leadership team is ULTA’s COO Kecia Steelman. She has extensive retail industry experience, particularly in store operations, supply chain, and IT. She has held senior roles at ULTA, Family Dollar Stores, and the Home Depot Corporation. She began her career at Target Corporation, where she worked in retail operations and merchandising for over a decade. Because this is still too rarely the case, we wanted to emphasize that among the 9 members of the leadership team, 7 of them are women, which for us is paramount given ULTA’s activity and type of consumer.
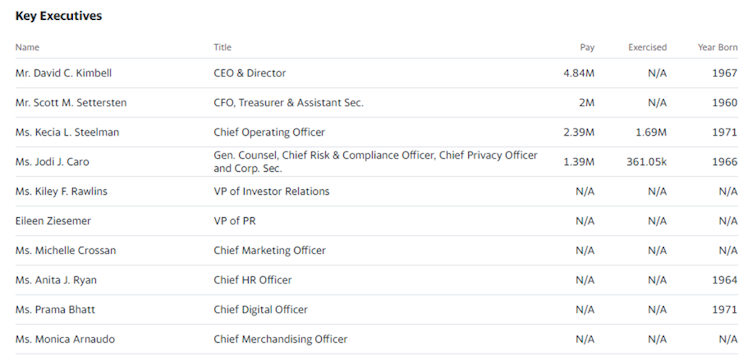
Source: Yahoo! Finance.
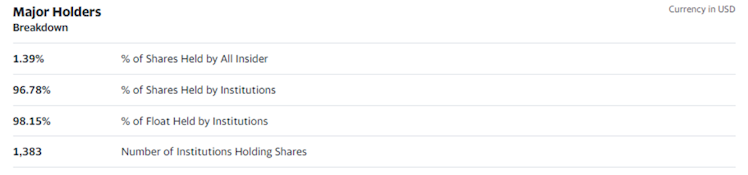
Based on the median value of CEO compensation by company size (revenue), current total compensation (included exercised stock options) appears low. Only 1.39% of shares are held by
insiders.
Source: Yahoo! Finance.
The company’s mission, vision, and values are as follows:
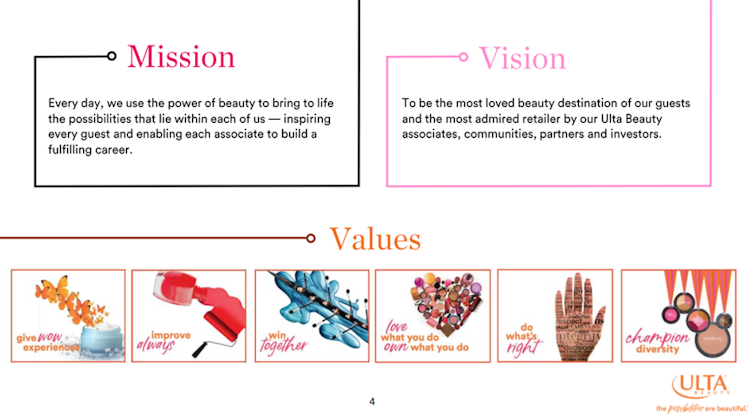
source: ULTA Investor Presentation (December 2022)
The company's management should be congratulated for establishing a clear and long term strategy with the aim to expand market leadership in the US and drive profitable growth.
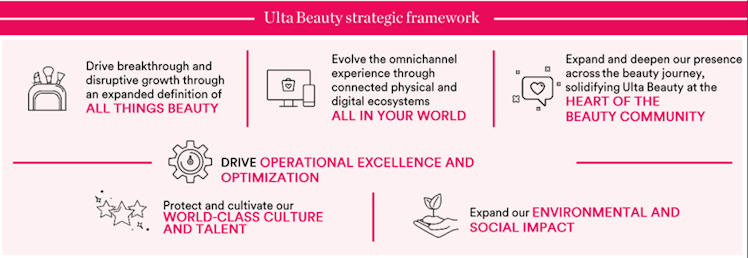
source: ULTA Investor Presentation (December 2022)
ULTA’s management well-executed strategy revolves around providing a comprehensive and engaging shopping experience for customers while maintaining strong relationships with its vendor partners. The company focuses on delivering a "wow" factor to customers by offering a wide range of products, expert advice, and personalized service in a welcoming
environment (“all things beauty”). Additionally, the company emphasizes innovation and invests in technology to enhance the shopping experience both in-store and online (“all in your world”). The company also prioritizes diversity, equity, and inclusion in its workforce and works to create a positive impact on its communities through various social responsibility
initiatives.
We like to see that ULTA’s strategy aims to serve the aforementioned growth drivers of the beauty industry, including improving its social media presence by building a new creator and content ecosystem and enhance its connection with key consumer cohorts. With regards to online shopping, the management wants to make ULTA the industry leader with personalized and
immersive digital experiences. Expand footprint via ULTA and Target “shop-in-shops” also aims to reinforce the company’s current omnichannel offering. A last block of ULTA’s strategy we wanted to highlight is its drive to operational excellence and optimization, including investment to build a guest-centric supply chain to support an fuel growth.
ULTA's capital-allocation strategy focuses on share repurchases and organic growth, which is evident from the board's authorization of an additional $2bn in buybacks last year. As already mentioned, the company also allocates approximately 4% of its sales to various initiatives such as new stores, digital experiences, and supply chain, with a larger proportion now being dedicated to the latter two compared to pre-pandemic levels. This shift is driven by ULTA’s desire to improve its omnichannel capability, its drive to operational excellence, and compensate for the deceleration in new store openings.
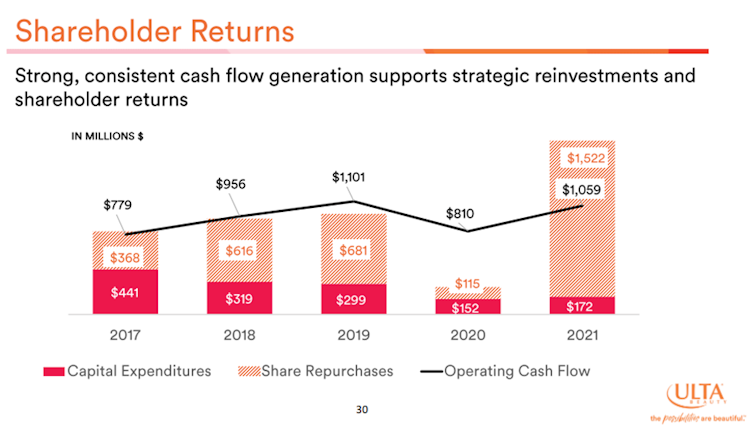
source: ULTA Investor Presentation (December 2022)
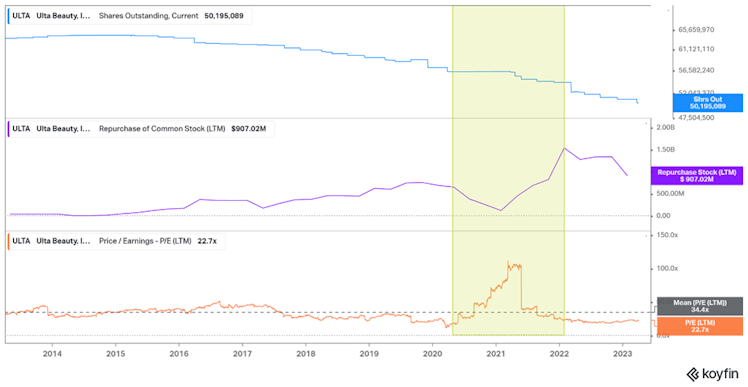
More than $4.8bn has been allocated to stock buybacks over the last decade. The below chart shows the relation between the number of shares outstanding, the current number of shares repurchased, and the P/E ratio. Share buybacks have been relatively well timed with a slowdown following March 2020 due to the impact of lockdowns and when valuation picked up well
above historical mean (P/E) before increasing when the overall situation became less uncertain and valuation appeared more reasonable.
ESG Considerations
Sustainable is part of the company’s global strategy. It is important to note that ULTA’s target consumer and more globally Gen Z share a common characteristic – they care deeply about
protecting the environment.
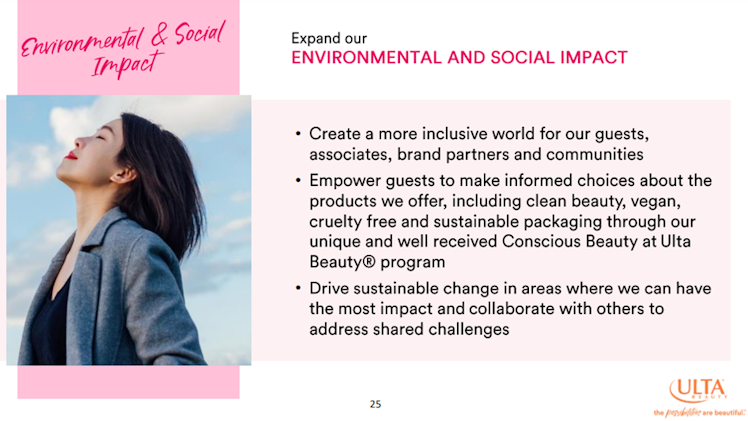
source: ULTA Investor Presentation (December 2022)
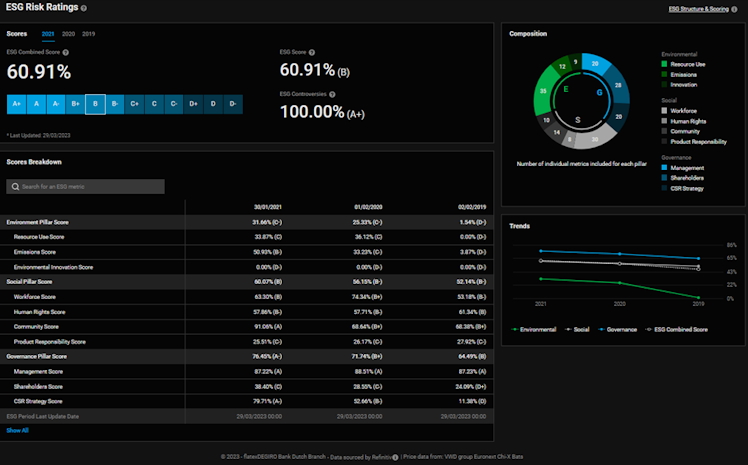
The company represents very limited ESG risk with a DeGiro rating of B, indicating good relative ESG performance and above average degree of transparency in reporting ESG data publicly.
Valuation
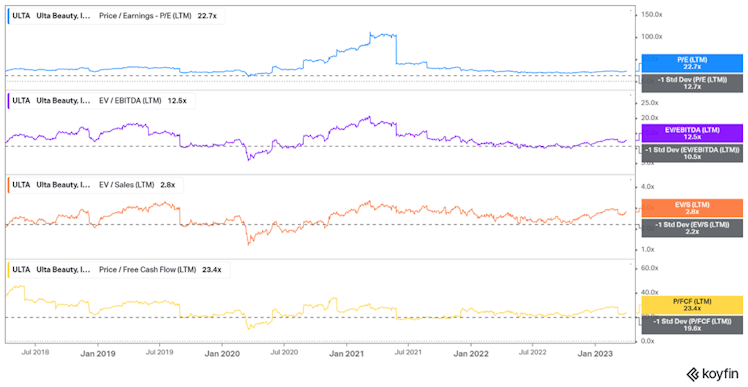
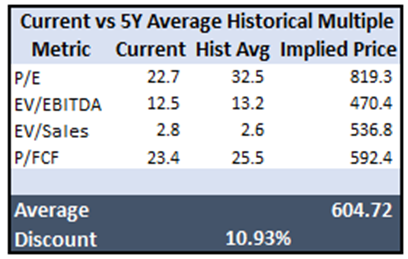
At present, the stock is being traded above the 5-year historical main multiple averages' -1 standard deviation. However, since ULTA's historical growth rates are unlikely to remain the same
in the future and the high 2020 ratios were influenced by the pandemic, it is difficult to draw conclusions from these historical ratios. We have provided a table of implied prices based on ULTA's historical average ratios for reference. Notably, the historical P/E ratio substantially increases the average implied price.
To avoid depending exclusively on multiples, we utilized a discounted cash flow (DCF) model to evaluate ULTA’s intrinsic value.
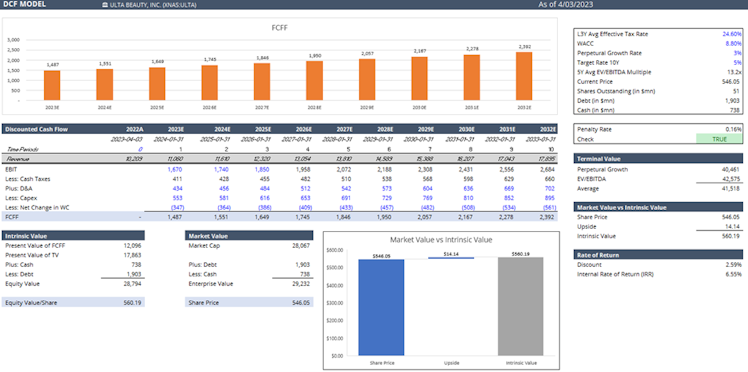
We employed a 10-year forecast period for FCFF, where we utilized consensus estimates for revenue for the first 3 years, followed by a gradual revenue regression to the industry's aforementioned 5% CAGR for the remaining 7 years. Additionally, we established a perpetual growth rate of 3%. After considering the company's next year operating margin guidance and consensus estimates for the following 3 years, we determined a flat 15% margin for the projected period. To estimate CapEx, we used 5% of total revenue (1% higher than 3-4% recent cycle) and historical averages for D&A and net change in WC.
The DCF model suggests that the current value of ULTA shares is reasonable, assuming stable revenue growth and EBIT margin of approximately 5% and 15%, respectively. As a further step in our valuation process, we conducted a reverse DCF model, which is shown below.
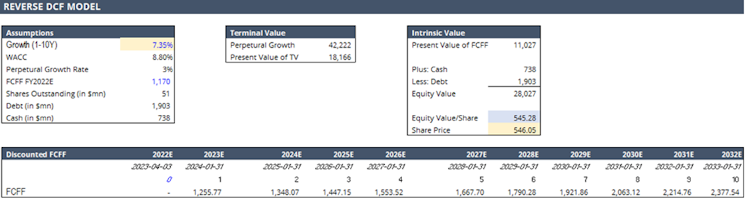
Based on the reverse DCF, the current market price implies an FCF annual growth rate of 7.35% for the next decade and 3% perpetually which appears reasonable, based on the growth perspective of the company.
Risks
The main risk for us comes from the competition. Sephora is the world beauty retailer leader, jewel of the French luxury empire LVMH, and ULTA’s main competitor. Sephora is adopting
a similar strategy with expansion plan targeting ULTA’s (only) market – the US. Exclusivity on specific products and market share gain stopping ULTA's growth trajectory could have an important impact on the company's valuation and further development.
- Statement from LVMH annual report: “Sephora is optimistic but cautious for 2023, and will clearly focus on differentiating further and continuing to build “the world’s most loved beauty community”. Sephora will continue to develop its omnichannel capabilities and will open over 100 new points of sale to win in its key markets of the United States, Canada, the Middle East, France and China. Sephora will continue to drive preference through product differentiation, with its carefully selected assortment of brands and products tailored to each unique customer profile, all while pursuing the Diversity & Inclusion initiatives that bring Sephora’s purpose to life”.
Disclaimer: The information provided in this post is for information only and solely on the basis that you will make your own investment decisions after having performed appropriate due diligence.
Already have an account?