Trending Assets
Top investors this month
Trending Assets
Top investors this month
Remember “The Price to Sales ratio on that is crazy!”
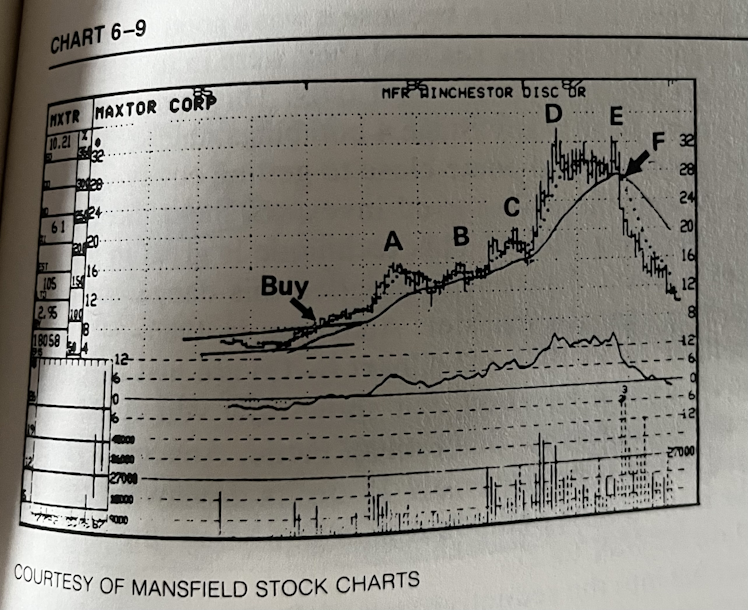
This weekly chart shows how using Weinstein analysis you would have ignored people complaining about high P/E Ratio at A,B,C,D & E. Your only sell signal would have come at F.
The example shown: the P/E Ratio was 16 at the buy, 24 at point B, 20 at point C, 33 at point D & 28 at point E.
Easy comparison to many stocks in 2020/21 just use P/S ratio instead.
These ratios don’t matter until they do. They can expand and expand. There are so many times in 2020 when I sold a stock because it had gotten too expensive, I remember $ZM as an example where I sold it at about $170 only for it to go to $588 high!
By using the exact rules shown below I would have sold $ZM at about $360 on the way down at the latest.
Worth thinking about. Reminder this a weekly chart so it likely takes in quite a length of time.
Especially for those he speak about holding for 3 to 5 years. What exactly is your exit strategy? Because by the time the fundamental issues become clear the stock will likely be already dead and buried.
Already have an account?