Trending Assets
Top investors this month
Trending Assets
Top investors this month
SLT Core Portfolio: Veeva ($VEEV) - Undisputed Leader In A Niche Field With A Sticky Suite Of Products.
VEEV is a cloud solutions provider specialized for the life science industry with solutions that enable its customers to go to market, sell, store data, coordinate, and maintain regulatory compliance efficiently. The company was formerly known as Verticals onDemand, Inc. and changed its name to Veeva Systems Inc. in April 2009. VEEV was incorporated in 2007 and is headquartered in Pleasanton, CA. The company employs almost 5.5k people and has a market capitalization of c.$30bn.
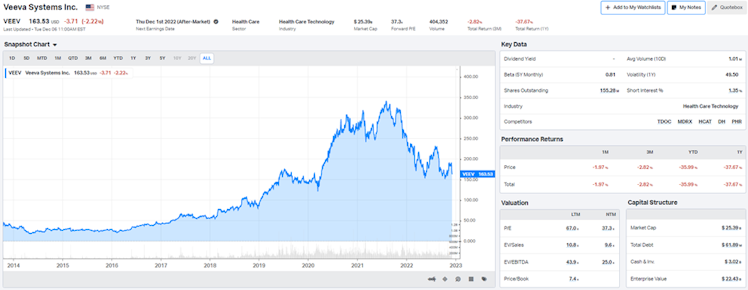
Source: koyfin
Investment Thesis
- VEEV serves two important factors in the life science space – innovation and regulation. The company has a substantial TAM of c.$13bn.
- VEEV develops higher switching costs for customers and it will become more difficult for competitors to enter the space and drive customers away from VEEV. Complementary offerings to flagship products makes the suite stickier. This is translated by a c.120% retention rate and combined with a 15% penetration of TAM, we believe it can support long-term growth targets and lead to a wider economic moat.
- High margins profile with healthy balance sheet and a significantly better than competitor's profitability.
- The company is still led by its founder and management introduced a strong culture with the “The Veeva Way”, a disciplined approach to achieve goals of long-term leadership in each product's market the company serves.
- We believe that shares currently trade around VEEV intrinsic value and given the above it offers an interesting opportunity to DCA on the name (as at 12/6/2022).
Description / Business Model
VEEV provides cloud-based software specific to the life science industry in North America, Europe, the Asia Pacific, the Middle East, Africa, and Latin America.
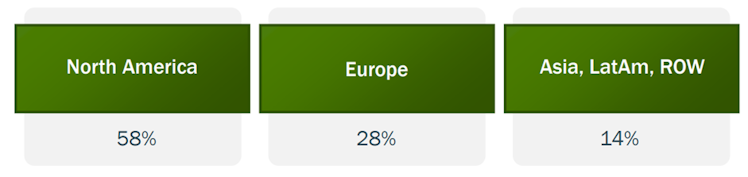
Source: VEEV Analyst Day.
The company offerings can be broken down into two distinct categories:
- Veeva Commercial Cloud (commercial solutions: 56% of FY2022 revenue), a suite of CRM software, data, and analytics solutions.
- Veeva Vault (R&D solutions: 44% of FY2022 revenue), a cloud-based enterprise content and data management applications for managing mainly research and development functions, such as clinical, regulatory, quality, and safety.
VEEV serves customer such as pharmaceuticals and biotech, medtech, and consumer products companies.
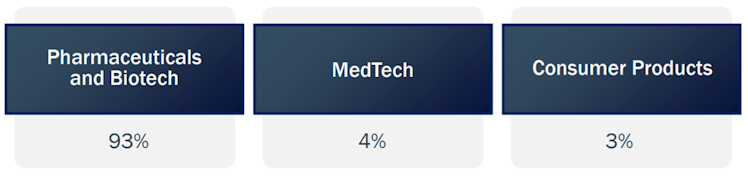
Source: VEEV Analyst Day.
VEEV follows a subscription-based business model. The model is logically based on the idea of selling a product or service to receive monthly or yearly recurring subscription revenue, with a focus on customer acquisition but mainly retention.
Competitive Moat
Since its inception, VEEV has built a broad moat by first creating cloud software for life science and then establishing itself as the industry leader and only platform for versatile cloud solutions.
The company competes with traditional vendors that don't focus on integrated life science platforms. Although competitors independently offer some of these solutions, no product on the market can offer an integrated platform similar to that of VEEV.
The company developed a significant competitive advantage over generic CRM vendors by focusing on industry-specific operational challenges, and quickly became the most obvious solution. One such example is the commercialization by a healthcare company of a new product, which requires successfully managing the several clinical trial phases, managing the
regulatory complexity on the road and ending up with the marketing of the product. VEEV platform does it all, and way cheaper thanks to being a SaaS cloud-native solution.
In addition to the cloud benefits, the VEEV platform consolidates traditionally isolated and independent workflows and enables its customers to manage the entire lifecycle of a drug. Industry best practices are also incorporated into the solutions, providing an additional level of quality assurance.
Over the years, the company has been very successful in attracting users of a single product to other complementary offerings, given the highly specialized and personalized approach the company takes to product development, as well as the sticky nature of its offerings.
Once integrated into a company's operational activities, the involved time and expense of moving to a competing software solution is high and comes with substantial operational risks. The latter could result in loss of data in the migration process, temporary disruption of sales activities or even ultimately delaying or cancelling product launches.
Once a customer tries some of the company's offerings and saves time and expenses, they often see the benefits of adding more offerings. As VEEV develops higher switching costs for customers, it will become more difficult for competitors to enter the space and drive customers away from VEEV.
The sticky nature of its products is a very attractive characteristics for a company and helps solidify its wide moat. The latest revenue retention rate was 119%, stable around 120% for the past few years, indicating not only customer retention but also significant additions to the average revenue per customer.
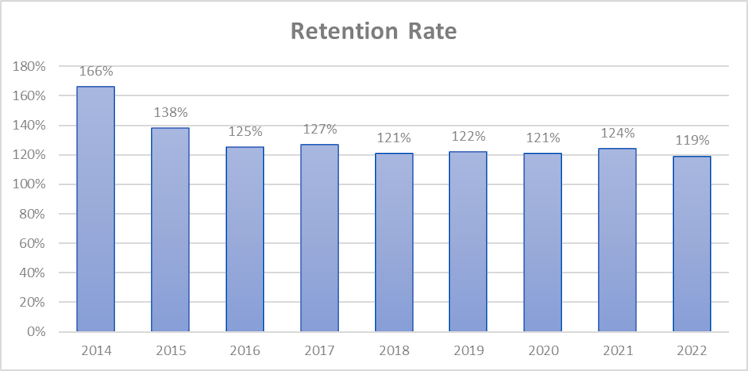
Source: VEEV filings
It is clear to us that VEEV exhibits wide moats, stemming from switching costs and to a lesser extent intangible assets (valuable brand).
Sustainable Growth
During its recent analysts/investors day, the company confirmed its growth perspective. VEEV operates in the more than $2tn global life science industry, in which the company is becoming essential to pharmaceuticals, biotech, and medtech companies. The industry is expected to grow c.6% CAGR in the long term.
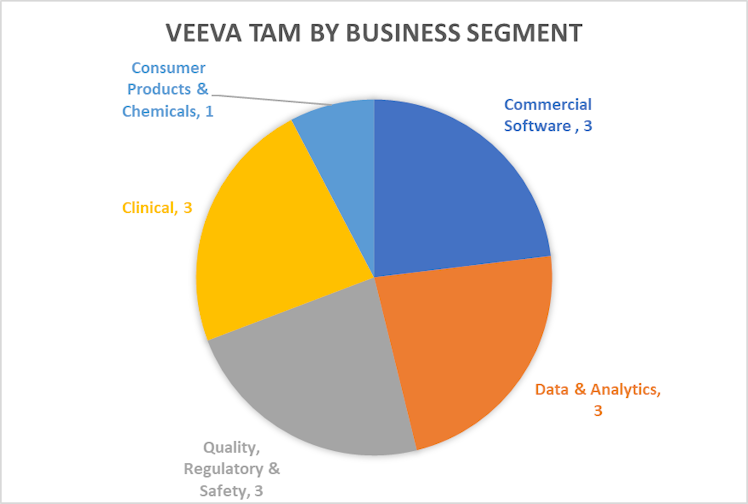
Within that, VEEV estimates its current TAM to be c.$13bn (up from $5bn in 2014, due to new products launched), which is made up of $3bn in commercial software, $3bn in data & analytics, $3bn in quality, regulatory, & safety, $3bn in clinical, and $1bn in consumer products & chemicals.
To assess the underlying growth opportunity, and given the company’s future expected subscription revenue mix (60% from R&D), it is interesting to look at R&D spend for VEEV's customer base. It pointed to a 7% R&D spending CAGR since 2016 and is expected to follow the same trend going forward, consistent with VEEV’s stated 6% CAGR.
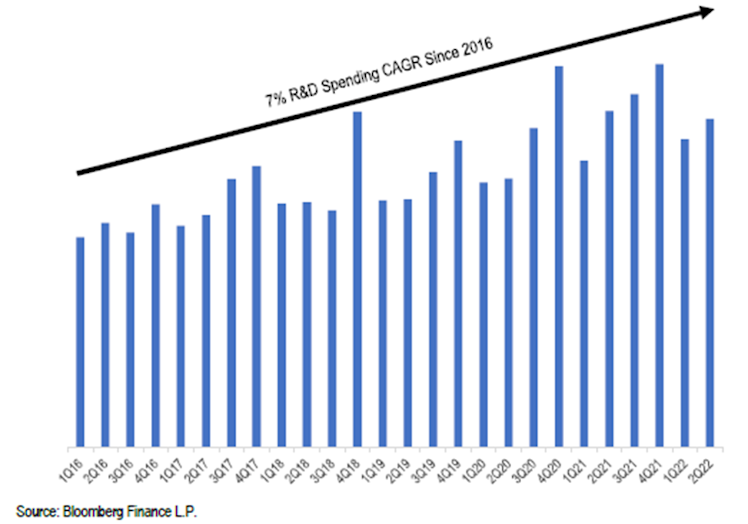
Source: JP Morgan
Additionally, even if VEEV is well established in the CRM segment (60% of the commercial solution subscription revenue and used by over 80% of the c.500K global pharmaceutical representatives), global penetration is relatively low with only a 15% share in the $13bn addressable market.
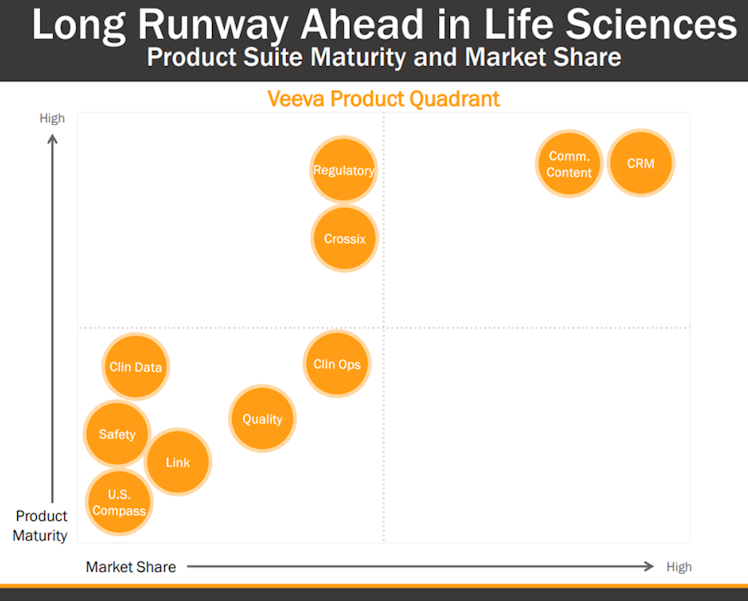
Source: VEEV Analyst Day.
As shown in the above products quadrant, 60% of VEEV’s solutions are still growing and with low market share, provide the company with strong growth opportunities. Notably, this encompasses the opportunity of solutions that VEEV currently has on the market and does not include any incremental capabilities the company may add in the future.
As a result, the company is a year ahead of its plan to achieve a total revenue of $3bn in 2025. Further guidance will be provided by the management once the 2025 goal will be achieved.
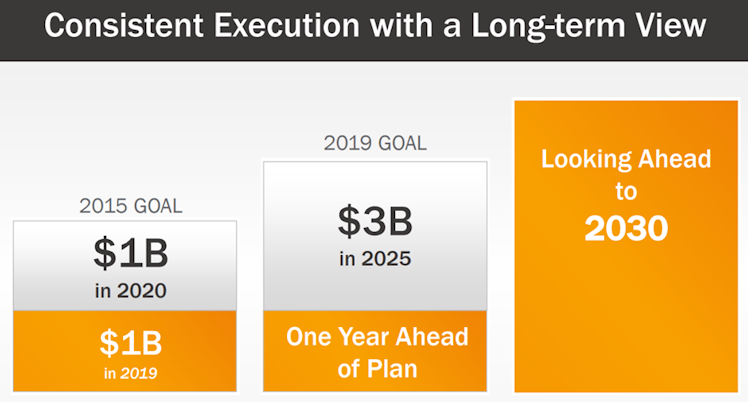
Source: VEEV Analyst Day.
HealthCatalyst published earlier this year seven biggest life science trends and three of them are clearly addressed by VEEV. One is acceleration in digitization, the second is the expanding use of real-world data and finally, scaling cloud platforms and securing data.
Financials
Before we start dissecting VEEV financial statements, it is important to precise that FY ends on the 31st of January each year, hence the FY is actually composed of 11 out of 12 months of the previous calendar year.
- Income Statement
After experiencing a mind-blowing growth of more than 100% at the beginning of the period, VEEV's revenue growth stabilized and is now variating between 20-40% p.a. since 2016.
Revenue has been multiplied by more than 14x over the period representing a 34.38% CAGR.
The company exceeded the $1bn milestone in 2019 (during FY2020), a year ahead of its goal announced in 2015.
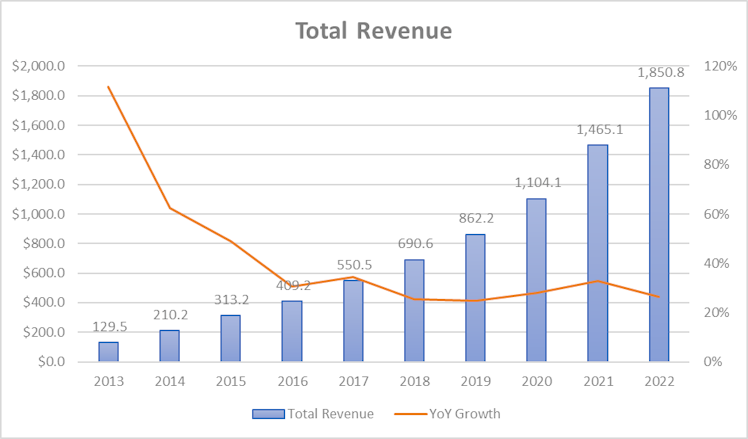
LTM revenue is $2bn and total revenue is expected to be higher ($2.15bn) for the full year 2022, a 16% increase YoY. As laid out previously, management has a target revenue of $3bn by 2025, and as for its former target, expects to reach it a year ahead of plan.
Consensus estimates are slightly more prudent. They see revenue growing c.15% for both in 2024 and 2025. As a reminder FY2025 ends at the very beginning of the calendar year and with a revenue forecast of $2.86bn, it is safe to assume that Wall Street is betting on VEEV achieving its target during the same calendar year (FY2026).
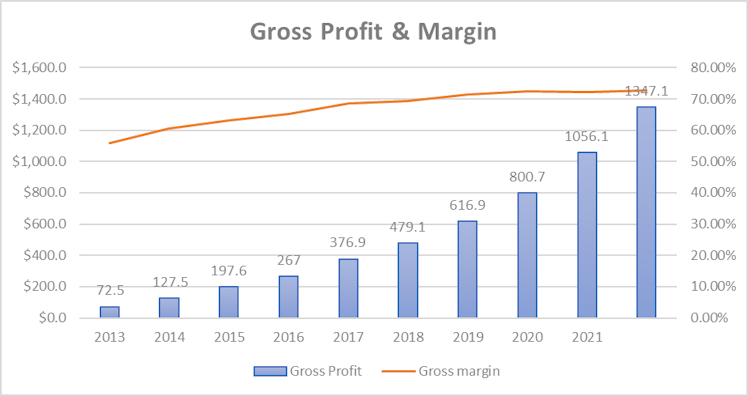
As the company scaled over the years, we can clearly see from the below chart the upward slopping gross margin trend, starting at 56% at the beginning of the period and ending around 73%, a non-negligeable 17% uptick. Gross margin seems to be constant for the last 3 fiscal exercises with the LTM period not being an exception.
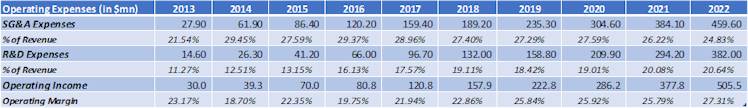
As usual we decided to take a closer look at operating expenses by decomposing them between SG&A and R&D expenses.
The former have been oscillating within a range of 20-30% of revenue and to understand what drove this fluctuation, we analyzed even further and looked at the S and the G&A items separately. Over the last 5 years, general and administrative expenses remained under 10% of revenue and the increase in SG&A was actually driven by more or less spending on the marketing side which is a good sign for us.
On the R&D side, the company almost doubled its allocation to this item (in % of revenue) – from 11.27% in 2013 to more than 20% for the last FY.
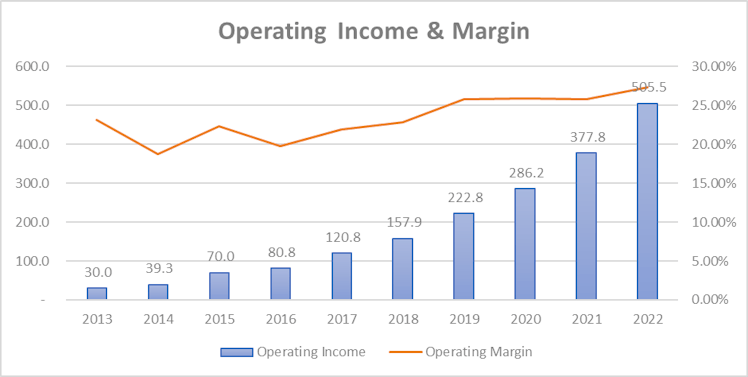
Thanks to its significant gross margin improvement, the “constant” SG&A expenses combined with a significant increase in R&D spending did not lead to lower operating margins, on the
contrary.
We appreciate management's decision to increase R&D spendings as it is important for the company to remain an innovation leader, support growth by deploying new products, especially given the fact that it was not done at the expense of the operating margin.
LTM operating profit is lower though at $481.2mn. One could think that despite rising revenue, margins have been impacted by the global macro environment. However when comparing the first two quarters of VEEV FY2023 with the first two of last FY, it is a 5% increase in R&D
which is driving margins lower.
Looking longer-term, the street estimates non-GAAP operating profit to grow gradually 8.15%, 13.25% and 18.74% in FY2023. FY2024 and FY2025 respectively.
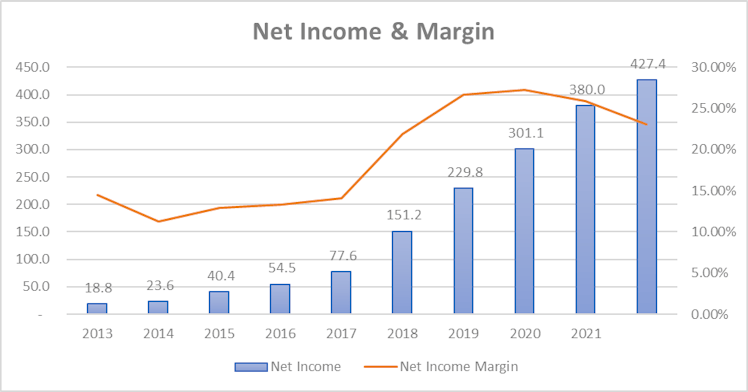
The company has a little (close to 0) use of debt and as a consequence, the main accounting entry left between operating and net income are taxes. As previously observed, both revenue and margins ameliorated, and so did net income. The important net income margin range is
entirely explain by different effective tax rates. As an indication, the latter was only 3.55% in FY2021 and jumped to 16.58% during the last annual report.
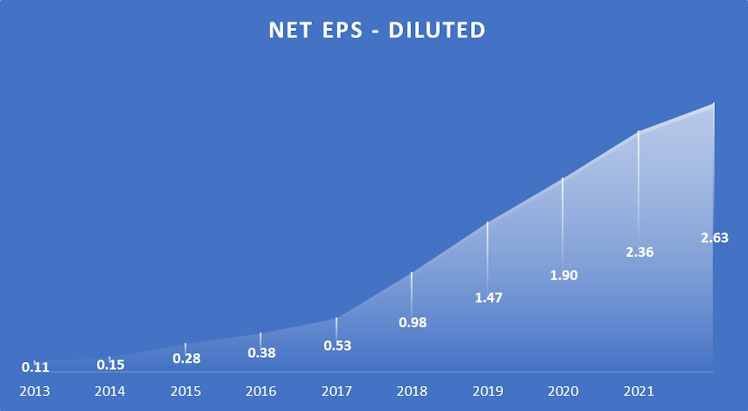
Diluted EPS has been multiplied by 23.9x, a bigger number than revenue, thanks to better margins. LTM diluted EPS is $2.42 and FY2023 EPS is estimated to be $2.57. Using 2023E EPS and current stock price, it represents an earning yield of c.1.35%. The company does not
distribute dividends.
Return on assets did not exceed 10% since FY2014 and is currently around 8%. After reaching 21.44% in FY2019, it declined significantly to 1.43% for the LTM. Return on total capital has been constant between 10-13% over the last years. Despite being not being particularly high, return on capital is still higher than the company’s WACC (7.96%).
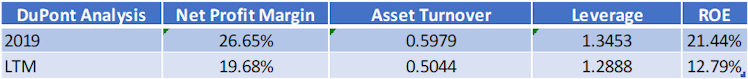
The below DuPont analysis provides us with more explanation on why the ROE dropped almost 10% in three years. The major part is explained by a lower net profit margin impacted by a higher tax burden as previously mentioned. Secondly, the lower asset turnover implies a
lower efficiency of the assets in generating revenue.
However, VEEV did not effectively become less productive and the lower ratio is explained by cash growing faster than revenue hence increasing the part of non-productive assets and lowering the asset turnover ratio. As we can see, there is an opportunity cost to keeping cash in the bank but not rushing to allocate cash and showing discipline and patience can be rewarding in the long term – this will be covered in the next section.
Comparison against the closest listed competitor IQVIA Inc. ($IQV):
From VEEV 10K: “The principal such competitor for our Veeva Commercial Cloud applications is IQVIA Inc. […] No single vendor offers products that compete with all of our Veeva Vault applications, but IQVIA […] and other smaller application providers offer applications that compete with certain of our Veeva Vault applications.”

VEEV gross profit margin is better by c.37.5% and both operating and net income margins are 10% higher than those of its competitor. In terms of profitability, the IQV debt to capital ratio of 70.3% naturally pushes ROE higher, which appears much better on a relative basis. Using ROA (it excludes the capital structure impact), we can observe that VEEV exhibits a better profitability.
- Balance Sheet
From a liquidity point of view, the company’s balance sheet is very strong. Current assets are 4.2x greater than current liabilities. As of 7/30/2022, the company was sitting on a total cash
and ST investments amount of almost $3bn, representing a bit more than 70% of total assets (c.87% of current assets).
From a solvability point of view and as previously mentioned, VEEV uses a unsignificant amount of debt, total debt to equity and capital are 2% and 1.9% respectively. The total liabilities over total assets ratio is 21.2%, confirming a low leverage, and the current Altman
Z-Score is logically very high: 28.04.
Goodwill represents 10.6% which is acceptable.
- Cash Flow Statement
Operating activities generated more than $764.5n of cash in FY2022. SBC added $234.6mn to CFO, representing c.38% of the later, and was the main addition to the net income to derive CFO. Adjusted from SBC, CFO was $529.9n. Change in unearned revenue (subscription
paid in advance reported as ST liability) is also a significant source of cash.
Financing activities subtracted $4.1mn in 2022 due to slight net negative issuance of stocks. However, the LTM cash from financing is $-33.2mn since management sized up its shares repurchase program in 2022 given the stock decline over a year (c.-40%).
Investing activities used $346.2mn during the last exercise, mainly for purchase of marketable and equity securities.
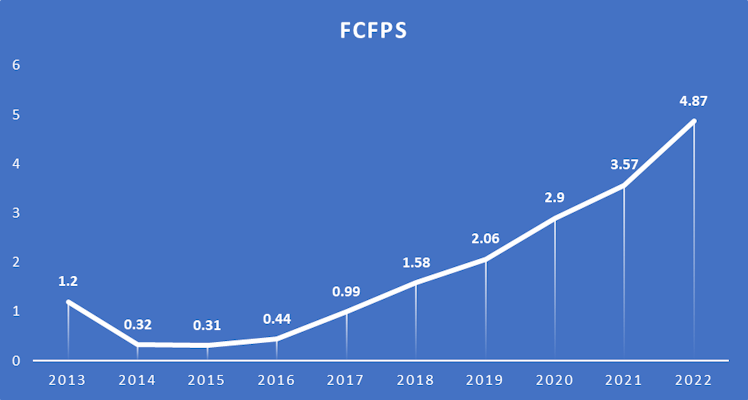
FCF was $750.2mn ($4.87/share, including SBC) and given current stock price and LTM FCF/share of $4.71, it represents a FCF yield slightly under 2.6%. Below is the evolution of FCFPS over the last decade.
Management and ESG considerations
Peter Gassner is the visionary founder behind the company and is the current CEO. With more than 30 years experience at leading technology companies, Peter has been at the forefront of every major transition in enterprise software, from the mainframe at IBM Silicon Valley Lab, to client-server at PeopleSoft, the cloud at Salesforce, and industry cloud software at VEEV.
Tom Schwenger is president and COO, responsible for strategy, sales, and services and has more than 25 years of life sciences industry expertise, especially within technology transformation. Brent Bowman is the CFO and brings more than 25 years of corporate and operational finance experience across the technology industry, including software,
hardware, services, and semiconductors.
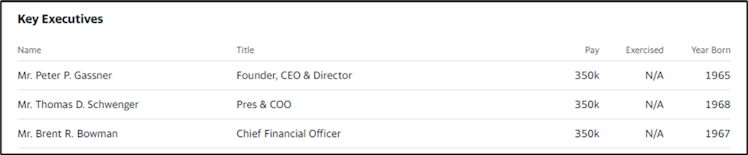
Source: Yahoo Finance
The company opted for a dual-class structure of common stock with the effect of concentrating voting control. As of 1/31/2022, VEEV’s founder and CEO, Peter Gassner, holds approximately 45.8% of the voting power of the outstanding capital stock and holders of the
Class B (10x voting rights) common stock hold approximately 51.4% of the voting power in the aggregate.
Management’s communication to investors is fluid. The company held an analyst/investor day recently and put the accent on its core value driving all management decisions.
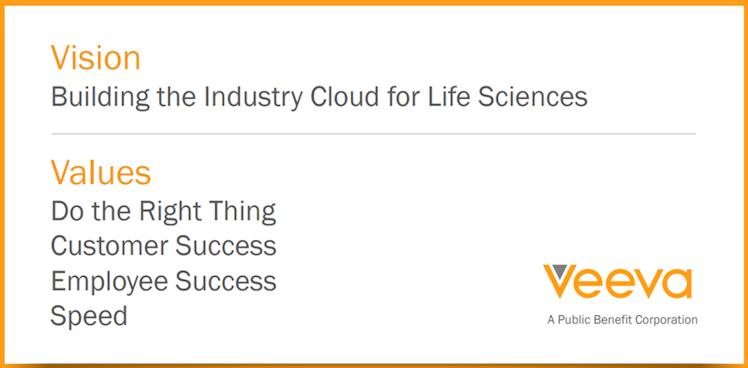
Source: VEEV Analyst Day.
The management introduced a strong culture with the “The Veeva Way”, a disciplined approach to achieve goals of long-term leadership in each of the product markets the company serves. The process is visually represented below and starts with targeting large product markets in which the problem being addressed by VEEV solution is strategic to
the businesses of customers. The company then focuses on developing best-in-class solution with the aim to eliminate legacy systems. VEEV forges strong relationships with early adopters of a new product to fasten its learning curve. The ultimate goal of “The Veeva Way” is to drive strong growth and profitability, which has been the case in the past. We particularly appreciate management's long-term, thought, and disciplined approach.
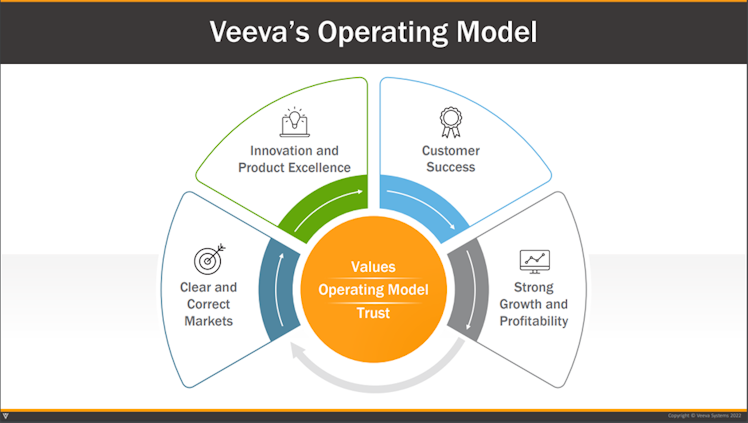
Source: VEEV Analyst Day.
As previously mentioned, goodwill as a percentage of total assets is reasonable and can be explained by the company relatively small M&A activity (in $ amount).
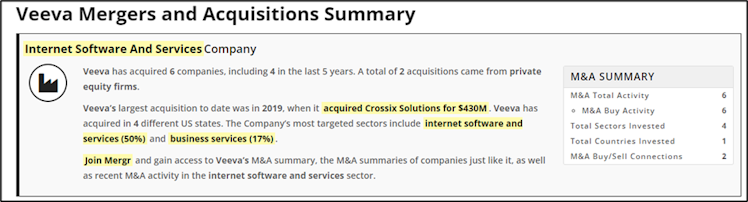
Source: mergr
The company does not distribute dividends and started buying back shares only during the last fiscal year. As seen in the previous section, capital has mainly been allocated to R&D, and
given VEEV’s level of profitability and business life cycle stage, we believe it was/is the right choice to make.
- ESG Considerations / Glassdoor Review
VEEV is not quite where we expect the companies we invest in to be but improved its ESG risk rating significantly over the last 3 years. It is also important to note that the below score is
impacted by the absence of 2 underlying score. We believe VEEV does not represent an ESG risk given their commitment towards employee success (one of its values) and inclusion/diversity.
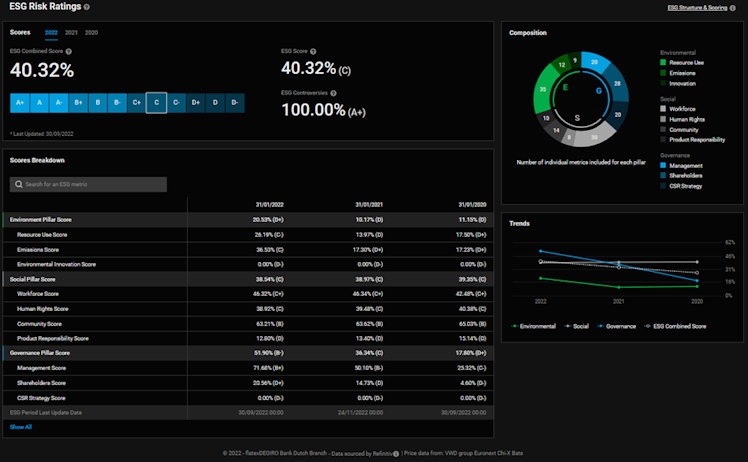
Source: DeGiro.
Supporting VEEV’s commitment to the social pillar, 78% of employees who gave a review would recommend a friend to work at the company and 88% approve Peter Gassner as the CEO of VEEV.
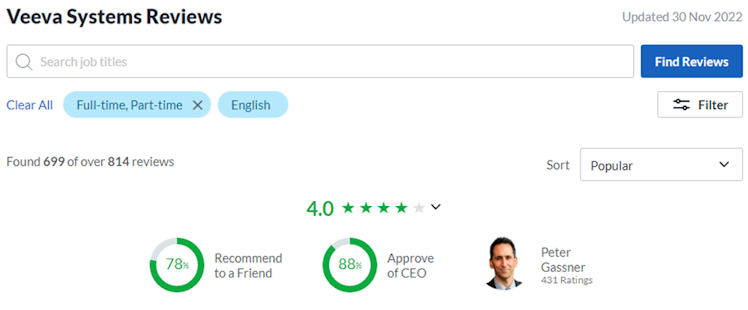
Source: Glassdoor.
Valuation
(As at 12/6/2022)
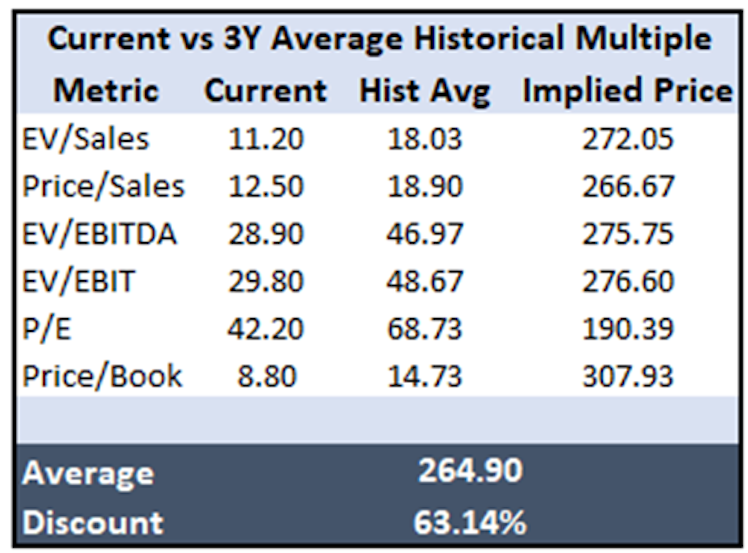
Compared to the 3Y historical average main multiples, the stock trades at a significant discount. However, we are conscient that the macro environment and VEEV growth’s perspective are different today. The company generated more than 30% EBITDA growth over the past 5 years, but compared to forward target for high teens growth, multiples should
appropriately reflect this.
Hence, we will base our valuation on both a DCF and reverse DCF model to assess VEEV intrinsic value.
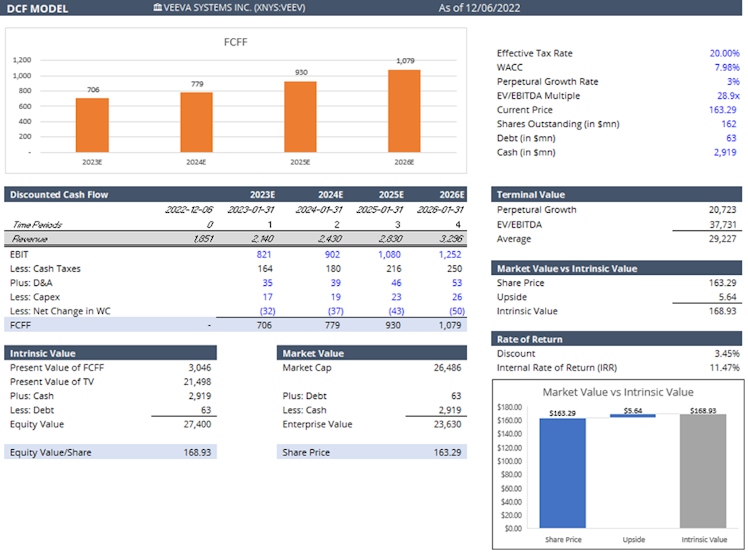
We waited the Q3 FY2023 earnings publication (1st December) in order to update our DCF model with revised consensus estimates. FY2023 provided guidance came a bit shy of expectations and shares fell c.15%. VEEV appears now to be fairly valued offering a small discount (3.45%) to intrinsic value. Let’s now see what the current price implies in terms of FCF growth and understand what are market participants current expectations.
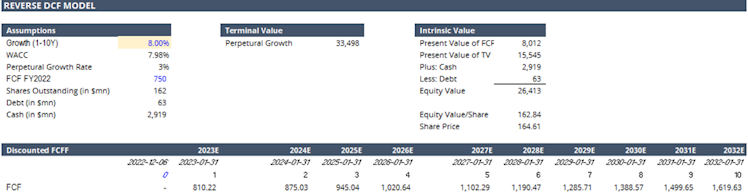
Our reverse DCF model gives us the information that the market currently prices in 8% of FCF growth over the next 10 years and 3% thereafter. Compared to the industry (pharma R&D expenses) historical growth of c.7% and VEEV’s long-term goal of 6%, we believe that growth expectations derived from the current share price are correct.
To conclude, we believe that current price is not cheap but given the company’s moat and potential, the current price around $165 is fair. We would be interested to DCA and build a position patiently over the next months.
Risks
Key risks for us include:
- VEEV falling behind of schedule on its FY2025 financial targets would put downward pressure to the valuation. If newer solutions are not successfully adopted by new and existing customers, the growth rate of VEEV revenue could be adversely affected.
- Competitive threats as VEEV continues to penetrate in its Commercial and R&D Solutions segments. If VEEV does not compete effectively, its business and operating results could be impacted.
We hope you found the analysis useful/insightful and as always, don't hesitate to upvote and provide us with your feedback in the comments section.
Disclaimer: The information provided in this post is for information only and solely on the basis that you will make your own investment decisions after having performed appropriate due diligence.
Glassdoor
Veeva Systems Reviews: What Is It Like to Work At Veeva Systems?
1,008 Veeva Systems reviews. A free inside look at company reviews and salaries posted anonymously by employees.
Already have an account?