Trending Assets
Top investors this month
Trending Assets
Top investors this month
Equities are suffering.
Most stocks are breaking lower daily.
In fact, our data signals the weakest breadth reading in months.

Let’s be honest, watching stocks bleed day after day gets old. The muted -.9% month-to-date performance of the S&P 500 masks the reality of markets right now.
While a handful of mega-cap Tech names thrive, the lion’s share of stocks are under relentless sell pressure. You’re probably hearing this on the lips of the media recently.
BUT this trend isn’t new. It’s been a big theme at MAPsignals for nearly 2 months.
Let me be clear, the data hasn’t flashed the green light… yet. That may sound like unfortunate news.
The more compelling story though, is this – most stocks are incredibly cheap. There are plenty of undervalued names out there.
Today we’ll dive into the data, revealing the true picture of markets. Then I’ll show you where you should be hunting for value. Deals are here!
Want to know the true health of the market? Follow the money.
Since going overbought on July 28th, the Big Money Index (BMI) dropped like a rock. This indicates that demand for stocks has ground to a halt.
As of this morning, the latest BMI reading sits at a fresh 5-month low of 41%:

While pundits proclaim that now’s the time to get bearish, we view that as a late call. Circled in red to the right is when we rang the alarm to prepare for a summertime pullback.
The evidence then pointed to a poor risk/reward setup near-term. Buying into a blistering late-stage rally is rarely a good idea.
Since that prescient call, we see a more favorable environment for one crushed area. One look at the recent outflows points squarely to weakness in small-caps.
Below plots the buy and sell signals in equities for the month of September. The weakest breadth reading in months is due to nearly 2:1 outflows in companies under $50B market cap:
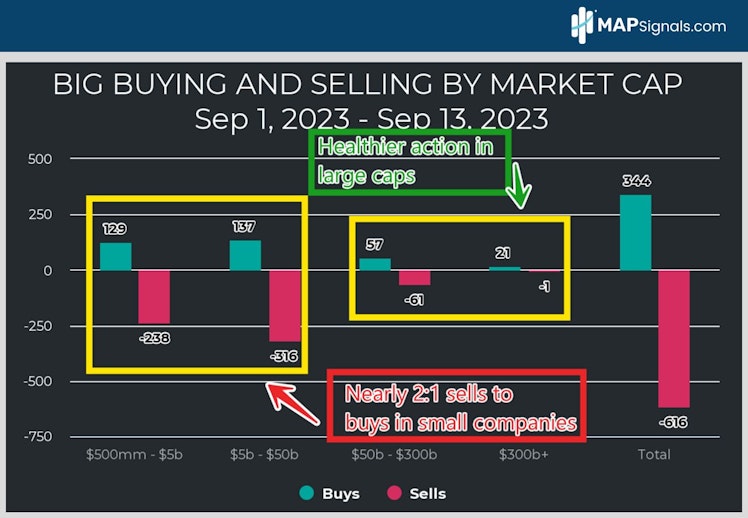
This is the sole reason our data is anchored. The higher-for-longer rate narrative has punished many groups, including Utilities, REITs, and Consumer stocks.
Seeing a lot of red can make one queasy. But it shouldn’t. This level of selling has pushed valuations to attractive levels.
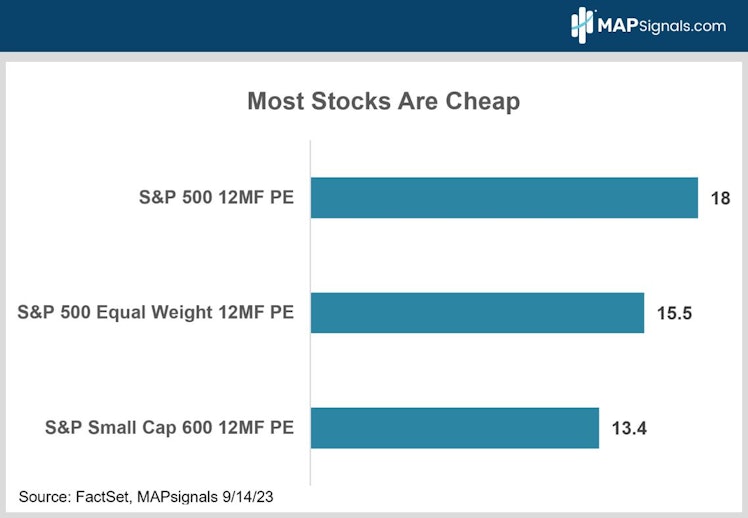
Consider this: The market cap weighted S&P 500 has a 12-month forward P/E of 18.4. That’s in the upper end of the valuation scale… not that exciting.
When you view the equal-weighted S&P 500, the P/E drops to a more favorable level of 14.8.
It gets better. Smaller companies offer the real value with a rock bottom forward P/E of 13.1. That falls in the lower end of the valuation spectrum.
Under the hood, most stocks are cheap:
When you think about it, low market breadth shouldn’t be a reason to frown. Rather it’s a reason to celebrate. It isn’t often that we see prior leading stocks sitting at attractive levels.
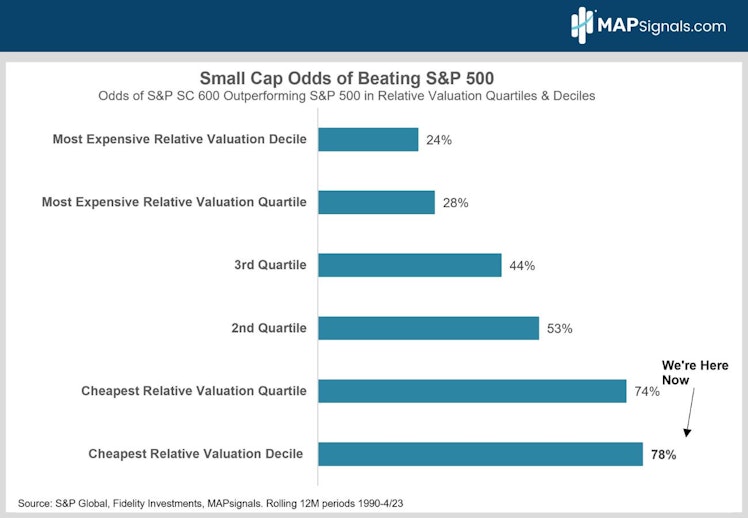
As Alec Young pointed out recently, when small caps have been this cheap relative to large caps, they’ve outperformed nearly 80% of the time over the next year.
The weakest breadth reading in months means it’s time to go shopping for deals in the small cap space:
Today’s big message is simple. A lot of equity destruction has already taken place, so it’s time to sharpen those pencils and get the shopping list ready.
Making superior stock selection is paramount.
Don’t be like most folks and wait until the coast clears to start grabbing stocks. By the time money flows begin plowing back into small-caps, you’ll miss the parade.
You want to fish when they’re biting.
As I’ve said numerous times, the September pullback is a great time to buy into weakness. A likely seasonal rally in Q4 suggests market breadth is set to increase in the coming weeks.
Buy the dip.
Ride the rip.
Let’s wrap up.
Here’s the bottom line: We’re in the midst of the weakest market breadth in months. The Big Money Index, aka the market’s North Star, has been signaling outflows since early August.
While the near-term environment points to weakness, valuations for small-caps are uber attractive. History shows that when smaller companies underperform large-caps by this magnitude, they outperform 78% of the time the next year.
This is where MAPsignals shines.
Our Top 20 lists auto-update signaling the top-ranking names under institutional accumulation. Many of the biggest winning stocks out there reside here.
If you manage money or are a serious investor, don’t wait for the media to blow the bull whistle for stocks. Rather, use a map! Get started with a MAP PRO subscription today!
MAPsignals
Solutions - MAPsignals
MAPsignals’ volume and price analysis tools enable investors to identify unusually large trading activities around individual stocks and ETFs. This allows traders and investors to move beyond sentiment with a more precise, predictive, and measured data analysis tool that MAPs the signals being delivered by the market’s biggest players.MAPsignals capabilities include: Read more »
Already have an account?