Trending Assets
Top investors this month
Trending Assets
Top investors this month
SOXS's three-day stock performance: insights from investors in the derivatives market
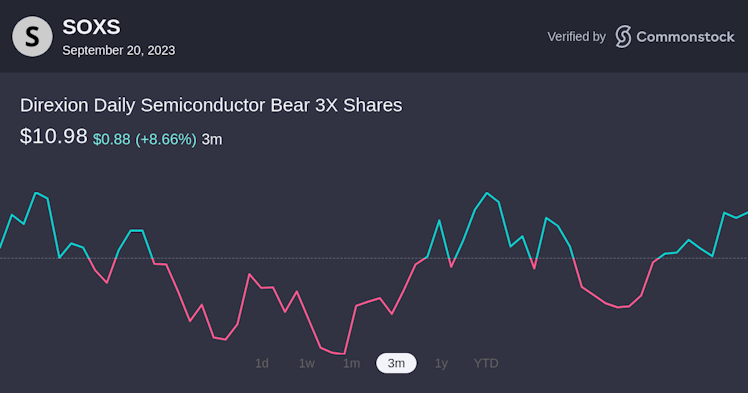
Review of SOXS's stock price trend
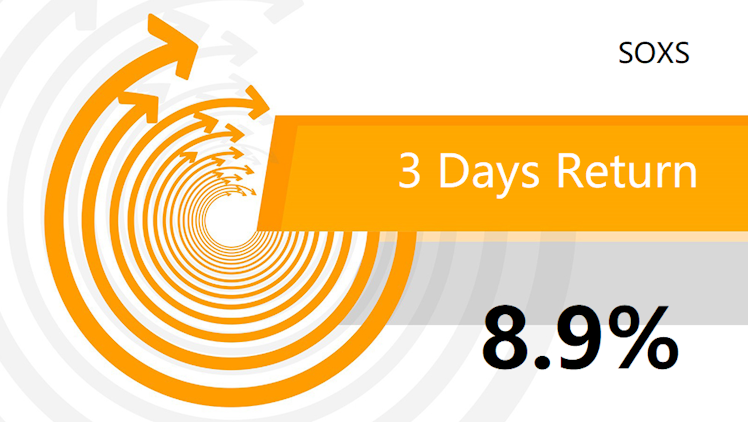
The data system will analyze the probability of the current stock price rise and fall for the index and individual stocks every day. We try to use the stock price change after 3 days to evaluate the effectiveness of the data system for stock price change analysis.
Take SOXS as an example. On September 14, the system judged that the probability of SOXS’s rise was 55%. The stock price rose in the next three trading days. The stock price rose from 10.1 USD to 11 USD, an increase of 8.9%. It can be seen that the stock price trend is consistent with the trend of the system's rise and fall rate analysis.
SOXS stock price trend analysis
SOXS has a 55% chance of rising, and the RSI value is 59. There are 4 bullish indicators and 2 bearish indicators in the indicator signals. That is, the market resistance level is 11.6, and it will rise above the resistance level to look at 12.4. That is, the market support level is 10.2, and if it falls below it, it may try 9.60.
Already have an account?