Trending Assets
Top investors this month
Trending Assets
Top investors this month
How to Play the September Pullback
Want to divide a room? Ask the crowd where the stock market’s heading.
Want to inform a room? Equip them with cold hard data.
As markets feel the pressure, here’s how to play the September pullback.
They say stocks climb a wall of worry. That’s certainly the case with 2023. The 17% surge in the S&P 500 this year surprised most pundits.
Hyperbolic fears of rising rates and inflationary pressures were set to sideline stocks. Yet, equities staged a big fat rally.
Crowd-think can be dangerous!
The big question now is, “what should investors prepare for in the coming weeks and months?“ We’ve got you covered. Data and history offer clues.
Our monthlong cautious stance remains: Expect more weakness near-term. BUT don’t keep the bear suits zipped too tight.
One historical study says this year’s rally likely isn’t over. More on that in a bit.
First, let’s size up the Big Money landscape…there’s a clear theme in play.
Since late July our data has signaled a risk off tone. Bids have been fading.
There’s no better way to visualize this than with my favorite indicator, the Big Money Index (BMI). It tracks the daily flows of buys and sells of stocks.
Supply and demand is the name of the game.
When the tide goes out of stocks, they fall hard. We’ve been in the midst of a major tide shift for 5 weeks. The BMI has been in free-fall:
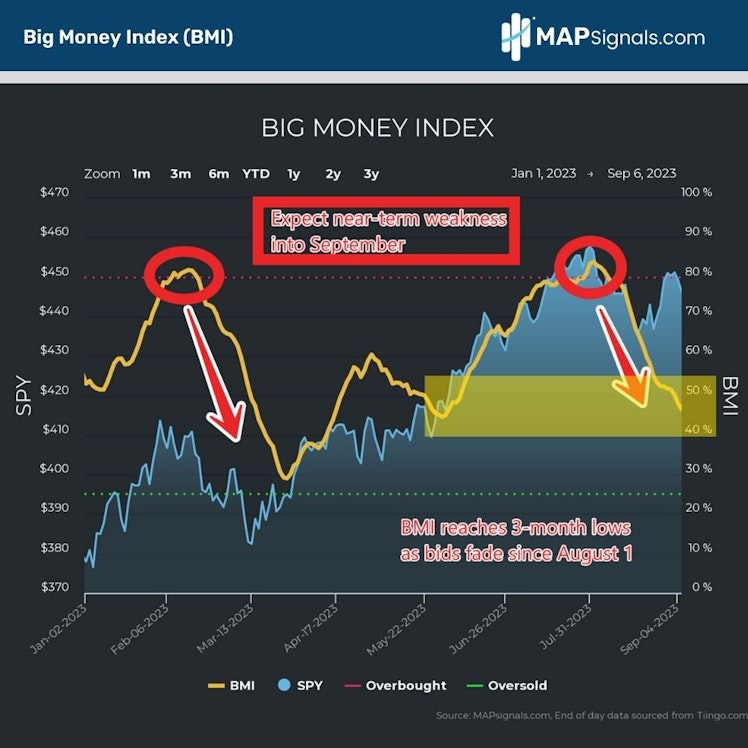
As of this morning the BMI sits at a 3-month low of 46.5%. That means that in the past 5 weeks, over half of our signals have been for sale.
While we have yet to see capitulation in our data, large outflows in rate-proxy areas like utilities and staples have been noted. We’re even seeing unwinding in discretionary names as well.
No doubt, large institutions are reducing risk.
While this can be unnerving, it’s not unusual to have seasonal weakness in August and September.
In fact, it’s quite common. That’s why we prepared you for a summertime pullback on July 27th.
Based on the latest trends, expect more volatility in the weeks ahead. Until the BMI troughs out, sellers are in control.
By now you may think all hope is lost. But you’d be wrong. There’s reason to be less fearful and more cheerful into yearend.
Now that the pullback is in full swing, it’s time to start thinking ahead. You don’t make money on Wall Street dwelling on today. You must focus on where we’re going.
If you’re curious on how to play the September pullback, we’ve got a playbook.
Here’s where history favors the bulls. Believe it or not, strong bull markets rarely die after a great start to the year.
Check it out. I went back and analyzed prior periods when the S&P 500 had similar early starts. In 2023 stocks gained 17.4% though the month of August.
Back to 1980, we’ve seen 16 examples where markets gained at least 10% through the month of August. Turns out, 81% of the time markets keep climbing by yearend:

That’s a lot of green! Only in 3 instances did stocks see red in the final 4 months of the year. Better yet, the average gain in the months of September – December sits at 4.9%.
That’s juicy if you ask me!
Based on the current setup, here’s how to play the September pullback:
- Pick your spots in a weak tape**.** As the BMI falls further in September, use the weakness to buy great stocks on sale. Take your time. Down markets offer deals to the patient.
- Expect better returns in Q4**.** As stated last week, pre-election years tend to have strong 4th quarter gains. Add to it that strong starts to the year tend to bring more gains in the final months.
Look, as I say over and over, pullbacks are opportunities over the long run. I trust that this one will eventually be no different.
Cold hard data suggests better days are ahead.
Let’s wrap up.
Here’s the bottom line: Stocks are not out of the woods near-term. Our Big Money Index (BMI) sits at a 3-month low as selling is picking up steam.
That said, history favors a bounce into yearend after strong starts to the year. Since 1980, when the S&P 500 is > 10% through August, stocks have gained a 4.9% on average though December.
Couple this data with strong pre-election year tailwinds, and you’ve got yourself a recipe for a yearend rally.
Weak tapes are great environments to shop for awesome stocks on sale. Once the tide turns north, my bet is you’ll be glad you did.
Finally, don’t trade the markets blindly. If you manage money or are a serious investor, get equipped with a MAP Professional subscription today.
Have a great week!
MAPsignals
Solutions - MAPsignals
MAPsignals’ volume and price analysis tools enable investors to identify unusually large trading activities around individual stocks and ETFs. This allows traders and investors to move beyond sentiment with a more precise, predictive, and measured data analysis tool that MAPs the signals being delivered by the market’s biggest players.MAPsignals capabilities include: Read more »
Already have an account?