Trending Assets
Top investors this month
Trending Assets
Top investors this month
@jazziyoung
Jazzi Young
$10.9M follower assets
We are a couple who've been together since the age of 18 (both now 55 as at 2022). We travelled this rewarding investment journey together, starting as Uni students with nothing to our names. We early-retired at the age of 50 & live off our investments
37 following1,057 followers
Might be our last post
Hi Folks,
This might be our last post. Looks like Commonstock is now checking geolocations and it's not permitting Australians on this site.

Managed to sneak in via setting our VPN server to a US location. Don't know how long that trick will last.
That's OK, we haven't been all that active here lately anyway. We've transitioned to almost a completely passive strategy so we can spend more of our retirement time enjoying other activities and mastering other challenges. We have a whole bucket list of skills and interests we want to pick up but never had the time, chance or opportunity. Since we're both under 60, with any luck we've got a few more decades of health span to achieve those goals.

We'd like to thank all the Commonstock folk we've had engagement with here. We've had fun telling our story and all the ups and downs of our investment journey.

Wishing all the investors at Commonstock all the best in your investment journey.

Signing out:
Colin & Helen
post media

Jazzi, i'm saddened to hear this. Hopefully the new Yahoo Finance Commonstock portal will be active sooner so that we can see more of your amazing posts. Hope you two enjoy Australia and master all the challenges you look forward to conquering with your retirement time.
+ 1 comment
Learning to Let Go - Additional Thoughts
We'd like to add some additional thoughts to @dissectmarkets excellent post on letting go of stock positions no longer serving you. We should always conduct regular pre-mortems on all our stock positions and mentally rehearse selling out of a stock on clear evidence the thesis for owning the stock is no longer applicable. Even if you have to crystallise a loss, releasing the mental taxation a losing position inflicts on you can be worth it. If there's little evidence you can make back your money any time soon, whatever's left is probably best deployed on better opportunities.

We'd like to throw our hat in the ring and bring up another aspect to "letting go" that few may have considered because it's so far into the future. We're assuming most of you on this site are still in wealth accumulation mode. We're financially free and both getting up there in age (late 50s). We're coming up to 8 years of being retired by choice. As you age, time gets much more valuable. You unfortunately start to lose older family members and even worse, a few friends to health issues.

We've always enjoyed the process of stock picking and investing in general. But to do it right takes time and effort. They say if you love what you do, it'll never be work. That's kinda true, but there's still an opportunity cost involved. The time spent researching stocks takes time away from doing other things. We both have a long list of other time-consuming pursuits we'd like to try in life but never had the time.

So we've had to "let go". We don't need to achieve anything more from our investment portfolio other than long-term market average returns. We're not super-rich, we can't go out a buy a super-yacht and sail the world. But we have enough. We've reached our financial freedom number that we know will sustain us for the rest of our lives in the lifestyle of our choice. That's all that mattered.

We've recently made the choice to go almost full passive on our portfolio. We still have our legacy individual stock positions that we'll continue to monitor (the effort is minimal). But the stocks in any businesses we own that no longer perform because they face secular headwinds will be sold ... within reason. There are capital gains tax implications that unfortunately have to feature in our decision to sell or not. Any proceeds from our disposals will be invested in our Vanguard Total Stock Market Index Fund ($VTI). This is our set and forget investment.

We'll still spend some leisure time reading about the markets during our morning coffee sessions. There might also be opportunities we might spot and act on, but those opportunities would have to be serendipitous. We won't be on active lookout for investment opportunities because our portfolio is pretty much set.

This diagram is a bit of an exaggeration, but we're letting go and choosing the left option:

For those still in wealth accumulation mode, you might find yourself entertaining the same thoughts when you reach your financial freedom number and get up there in age. Right now you probably can't imagine life without being fully engaged with the market, but it's unlikely you'll be the same person after opting out of your career/profession. You'll rediscover these ambitions to chase other goals that sat on the back burner because you didn't have the time for them, just like we did. Trust us ... if you're goal oriented and have a variety of interests in your life, when you quit work there still won't be enough time in the day to do everything you want to. You'll wonder how you managed to fit things in when you were still working 9 to 5 !

post media

I loved the additional thoughts you've written @jazziyoung and thanks for sharing my post to the community! It's great hearing your interpretation of "letting go" in the sense of investing and I hope others can write their own thoughts on what they see in their investing journey as "letting go". I admit, being an index fund investor who invests in the covered call version instead of the popular version, life does feel like a vacation from the investing sense because we just buy, reap the dividends, and see our portfolios continue to grow.
Add a comment…
We were so close !!!
We came so close to reclaiming the all time highs ! Seems like enough stock market participants acted on the "overbought" narrative to cause the market to retreat. This is all part and parcel of a recovering market recording a very strong upward leg. The supply of willing buyers can start to exhaust ... for a little while at least. Bullish sentiment will still remain intact among traders for as long as the S&P 500 index trades above a rising 50-Day and 200-Day moving average.

The good news from a technical perspective is the percentage of stocks trading above their long-term and short-term moving average is broadening. It would be healthier to see a rising market become less reliant on the Magnificent 7 mega-cap stocks, but since they represent around 30% of the S&P 500 index, their influence on the index isn't going to wane any time soon. Broadening the number of up-trending stocks is always going to be welcome news.

I wonder if the strength of this uptrend has been heavily influenced by active fund managers window dressing their funds. Given the S&P 500 index is up more than 20% this year, no active fund manager wants to be caught out reporting a high cash position in their equity fund. This thing about a strong rising market is it's "reflexive". A rising market attracts more money into the market driving prices even higher. Let's see if this Santa rally still has legs.
post mediapost media

We Should All Be Feeling a Little More Happier about our Portfolios !
November turned out to be a cracker, almost fully recovering the -10.3% down leg we suffered from late July. The following table shows the current gap from the all time highs for each major US index:

The S&P 500 index and the Dow Jones are a stone's throw away from reclaiming all time highs. The tech-laden NASDAQ composite index has some way to go, while the small-cap focused Russell 2000 Index is tail-end Charlie by the country mile. With any luck, the current wave of market optimism continues into the New Year to deliver us new all time highs. I hope Santa is listening.

If we look at the chart of the S&P 500 index since the start of 2022, we can see our bear market journey before a gradual ... and sometimes fragile ... recovery. I have to admit, I was feeling a little nervous when the recovery stalled and we had to endure another -10% down leg. The rally in November was quite a relief.

If we look closer at the technical picture, this recent up leg restores the bullish optimism as we're trading well above the up trending 50-day and 200-day moving averages. We should expect the possibility of some friction around the 4,600 to 4,610 level. Don't be surprised if the market takes a bit of a breather and finds resistance here. If we blow past this level, there's a good chance the market has enough exuberance to challenge the all time highs. Wouldn't that be something ??

One of the criticisms of this market rally has been the concentration of gainers has been very top heavy. The mega-cap tech companies have been the key stocks driving the indices higher. Looking at the market breadth, we can see a smidgen above 50% of stocks trade above their long-term moving average. Breadth comes in at a healthier 74% of stocks trading above their shorter term 50-day moving average. This is a reflection of the strong November we had in the market. If we want to see a sustainable rise to new all time highs, we preferably want to see the majority of stocks trading above their long-term moving average. A market is healthier when a broad range of stocks drive the market higher.

Finally, let's compare this current bear market to the ones of the recent past. It's looking like our recovery might take a little longer than the bear market of '87, but we've hopefully and thankfully avoided the deep drawdown and the long, protracted recovery of the calamitous 2000 and 2008 bear markets. This one certainly felt long enough thank you.

Let's hope December continues our good run. There's nothing better than celebrating Christmas and New Year with a stock portfolio at all time highs ! Opening that bottle of bubbly would feel oh so sweet.
post mediapost mediapost mediapost media

RIP: Charlie Munger
Sad news to hear about the passing of a great investor teacher and a legendary thought leader.

Charlie Munger was a huge influence in shaping our investment philosophy ... as we're sure he was for many others.

Some of our favourite quotes of his:

"More investors don’t copy our model because our model is too simple. Most people believe you can't be an expert if it's too simple.
How did Berkshire’s track record happen? If you were an observer, you’d see that Warren did most of it sitting on his ass and reading."

"I never allow myself to have an opinion on anything that I don’t know the other side’s argument better than they do."

"If you remove just a few of Berkshire’s top investments, its long-term track record is pretty average"

"If you’re not willing to react with equanimity to a market price decline of 50% two or three times a century, you’re not fit to be a common shareholder and you deserve the mediocre result you’re going to get"

"Warren Buffett has become one hell of a lot better investor since the day I met him, and so have I.
If we had been frozen at any given stage, with the knowledge we had, the record would have been much worse than it is.
So the game is to keep learning, and I don't think people are going to keep learning who don't like the learning process"

There are many more. Thank you Charlie for making us all better investors.
post media

Saddest day in the history of days! I’m not even joking. This is the biggest hit for me
+ 3 comments
Young, aspiring stock market investors can get a leg up by using the right type of leverage.

You benefit from time leverage by paying someone else to do all the ground work. This frees you up to spend your time focusing on what you do best. Don't underestimate the value of leisure time when you're working full time. Take it from us, time is a precious resource that you can't get back. You can also benefit from intellectual leverage by seeing how it's done and learning from the experts.

Our CommonStock friends at @stockopine provides the right kind of leverage for stock market investors. You'll see first hand the kind of dedication it takes to become expert business-oriented stock pickers.

Please consider subscribing to their service. They'll provide exponentially more value than your modest outlay for a subscription. We've deliberately made sure we're at arms length when we recommend a service by ensuring we get no compensation or benefits. We just know genuine expertise when we see it.

post media

You made our day and we greatly appreciate this genuine support Jazzi team 🙏 Thank you so much. As you have implicitly indicated, the fee we charge is negligible compared to the efforts we put to deliver our reports. One great idea can pay for the subscription.
+ 2 comments
The Reality of being a Long-Term Investor in a High-Growth Business
Mercado Libre ($MELI) has regained its rightful position as our second largest individual stock position behind Apple ($AAPL). This excludes our Market Index ETFs which deservedly command the bulk of our portfolio allocation (around 70%). Mercado Libre accelerated past our large, but snail-paced position in Coca Cola ($KO) which we consider to be a terrific dividend stock. Apple ($AAPL) continues to hold top spot in our individual stock portfolio by a country mile.

This chart shows the realistic journey of a long-term "buy-to-hold" investor in a high-growth stock like $MELI. Even if you focus on the execution of the business and the growth trajectory that lies in front of it, the stock price will still take you on a rollercoaster ride. The onset of the Covid pandemic saw the stock retreat by almost 35%, but the worst was yet to come. From September 2021 to June 2022, the long-term investor had to endure a 68.6% drawdown. This is painful for any investor with a reasonable holding in this stock. But past experience can be reassuring and this is the advantage of a long-tenured investor. We've lived through similar drawdowns with Amazon and Coca Cola.

From current levels, the stock price needs to rise another 30% to recapture its historical highs of January 2021. Given time, we're pretty confident this will happen and the stock will rise even higher over the long term. The growth opportunity for Mercado Libre continues to be lucrative and it's there for the taking provided they can execute.

If we had posted this chart on Twitter/X, we know some snarky person is going to tell us we should have traded the stock to save ourselves the paper drawdown. Yeah ... easier said than done. Timing your position in and out of a stock to capture the bulk of the rise while avoiding the declines is very, very difficult to do consistently. There's a reason why trader survival rates are so poor (reportedly less than 1% after 5 years).

The job of a long-term investor is to remain focused on the business and the opportunities that lie ahead of it. We can't do anything about the stock price, except maybe buy more whenever it dips when our business thesis is still intact. The stock price of a good business will unavoidably fall when fear grips the general market and earnings multiples contract. The stock price can also rise well above any justifiable earnings multiple in times when the market is exuberant. This is the cross we bear as long-term investors. We focus on holding good businesses, the stock price will act on its own accord. Over the long-term the stock price will eventually find its rightful level to reflect the growth of the business.
post media

TA Opinion: S&P 500 index Chart Technicals looking Precarious
It's been a while since I last posted. We were enjoying a very nice (but cold) vacation in Queenstown NZ. Unfortunately on our return, we tested positive for Covid after feeling a little under the weather. This took us out for another week. We're just getting fully recovered now.

during my vacation I noticed our market recovery seems to have spluttered. I'm sure everyone's portfolio has felt the effects. Stubborn inflation, high interest rates, prospects of another potential rate hike, wars, an unsettled political landscape ... these all contribute to poor investor sentiment. The technical analysis picture is looking a little gloomy with the S&P 500 index dipping just below the all important 200-Day SMA. The 50-Day SMA is in a downtrend showing how weak we are short-term.

We don't really want to stay below the 200-Day SMA for long. If the selling pressure continues, then we really need to see support at the 4,200 key level. If that level fails to hold, then it's less clear where buying support will eventually step in. One can only hope the investors and traders who are in "risk off" mode have already sold down their positions and the selling pressure eases. Unfortunately, these things can feed on itself. Selling pressure causing prices to fall, tipping more nervous investors into selling.

When we look at our recovery from "The Great Inflation" bear market, we've stalled. Our recovery was tracking in line with the Crash of '87, but this recent down leg seems to have dashed that hope. This is the thing about the stock market - hopes get dashed and patience gets worn down. Mr Market likes to inflict maximum pain, and if he can't do it by inflicting the deepest of drawdowns, he'll certainly make the recovery agonisingly drawn out and tiresome.

Market breadth is a stinker as well. We've always knew the market recovery was largely being led by the mega-caps. The hope was the market rally from bear market lows would eventually broaden. But the percentage of stocks above their 200-Day and 50-Day SMA has really taken a tumble in recent months.

As usual, there's not much for a long-term investor to do other than grind it out and stick to plan. Keep putting your savings to work and know the good times will ... eventually ... return. Let's say the last couple of years for investors have been excellent for "character building" !
post mediapost media

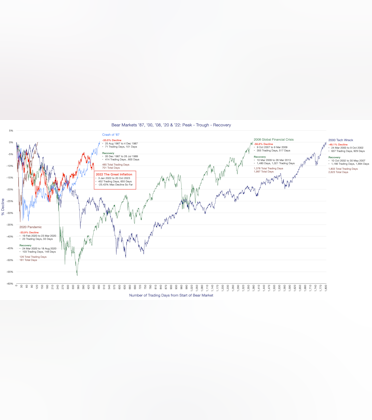
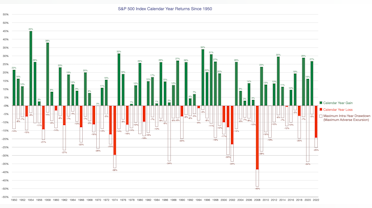
This chart is one of my all-time favourite charts of the stock market for 1950 to end of 2022:

It shows the S&P 500 annual gains (green), losses (red), and the maximum drawdown investors had to endure for each year. Traders call this the maximum adverse excursion (MAE). Every year the stock market records a healthy gain, they're always be a market decline within the year.
Calendar year 2020 was extraordinary: it closed with a 16% annual gain, but we had to endure a 34% decline between 19 Feb 2020 - 23 Mar 2020. This was the market reaction to the CoronaVirus pandemic. Any long-term investor would've experienced a significant drawdown in portfolio value, yet still end up with an excellent calendar year return if they held their nerve. This is a chart I get new investors to stare at for a long time. because I need them to take it all in. When someone is just starting their stock market journey, it's hard to describe the range of emotions you go through when you put your hard-earned savings at risk. Most beginner investors tend to focus on the upside, it's exciting to think about the fortune you're going to make. But I like to concentrate their attention on the downside because that's where the real risk lies (behavioural risk). I need them to understand the "noisiness" of the market.

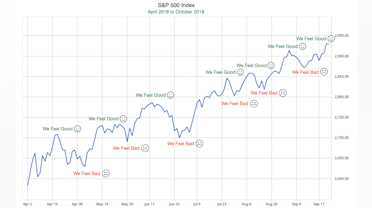
Of course another favourite chart is the classic chart of the jagged uptrend and the cyclical range of emotions we go through. Investors have to accept that paper drawdowns are a feature of a long-term strategy, not a bug. You simply can not avoid it.

I always mention that "volatility composure" is something a long-term investor develops with experience and tenure in the market. It's difficult to imagine how you'll feel when you start enduring portfolio losses, especially when it extends over a long period of time (death by a thousand cuts). We're not emotionless automatons, even the most experienced investor is going to be annoyed watching your portfolio drop in value. We just don't allow our annoyance/pain/fear dictate our investor actions. We don't deny our emotions, we accept them for what they are, we just develop better agency over our actions. Mastery means no knee-jerk reactions.

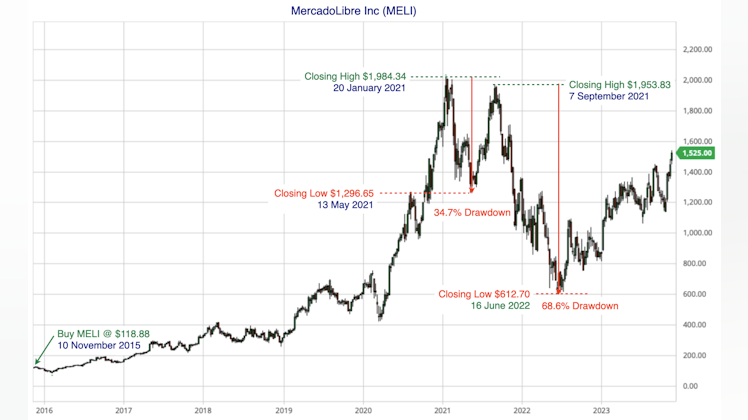
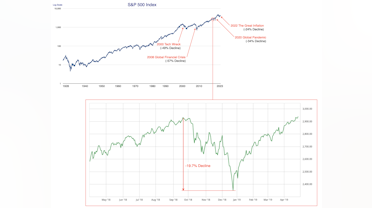
This is another chart I like to show. We always remember the 2000 Tech Wreck, 2008 Global Financial Crisis and 2020 Global Pandemic. But there are plenty of other significant corrections that affect our portfolios that forgotten over time because they're more "run of the mill". They're not notable in history and only look like a tiny squiggle in the long-term chart. This sort of correction can happen at any time and it can still be painful.

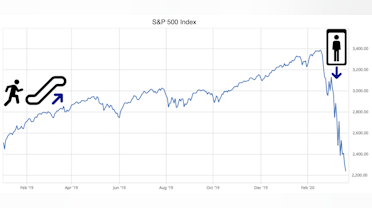
The "up the stairs, down the elevator" chart is a favourite metaphor. Growing your wealth requires a great deal of patience. Holding your nerve during a stock market calamity requires steely determination.

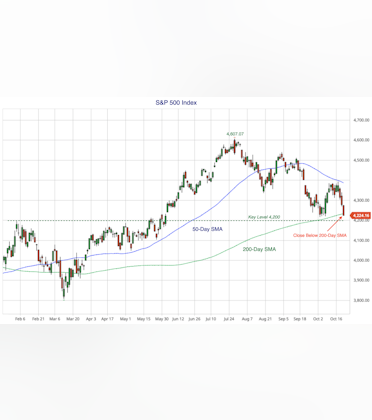
This chart is a little boring, but really important. Knowing your long-term base rates keeps your return expectations reasonable. It's also useful because If you find yourself lagging market returns by too much over the period of several years, you'll need to take remedial action. You first need to diagnose the problem. Maybe stock picking isn't your cup of tea. Maybe timing the market wasn't such a good idea.

If you know your base rates and the returns of the best investors to do it in history, you have a good envelope/guardrail of returns to work with. This can keep you safe from falling victim to the numerous scams and shams out there. One of the greatest investors to ever do it was Peter Lynch who racked up a 29.2% average annual return over 13 years. If someone is selling you a higher return, it's either very high risk, not sustainable long-term and/or very likely a sham. If you can beat Peter Lunch's record sustainably over time, you're a legend. But when you first start out, set your expectations realistically. Over the long term (or even medium term), the relationship between risk and return can't be beat. Higher returns always come with higher risk. It's a law and it's immutable.
post mediapost mediapost mediapost media

Another Tough Day in the Market
It's been a very sobering couple of weeks on the US stock market with macros & politics continuing to drive negative market sentiment. The predominant narrative has been worries about how much higher the Fed will raise interest rates and whether they'll be high for longer. Now we can add the looming Government shut shown to short-term negative sentiment. That the key takeaway for long-term investors, it's short-term worries driving the stock market lower.

The TA picture for the S&P 500 index shows us just how strong that negative sentiment is driving the market lower.

We're well below the short-term 50-Day moving average which is now turning down to confirm a short-term downtrend. You can see we had a series of red long-body candles as well as a gap down. This is all ugly stuff. The key level that every market technician is going to be looking at is near the 4,200 level. That's the convergence between the expected support line based on the "change of parity" hypothesis (what was once resistance has now become support) and the all important 200-Day moving average. If we break sustainably below this level, we could be in for some further pain. Usually you'll see some "stickiness" at this key level as the battle lines between bulls and bears are drawn. If the macro news gets worse, no TA support line is going to work.

When we're a net buyer of stocks, we're told to frame market dips as a positive because we can buy your favourite stocks and funds at a cheaper price. While true, the reality is it's easier to buy when the market is rising because we're helped along by the dopamine hit of a portfolio balance on the rise. When the market is falling, we tend to begrudgingly buy more stocks or units in our funds because we know it's the right thing to do. But there's no dopamine hit and it feels like there's little to celebrate. The market doesn't suit those with a delicate constitution. Short-term pain is the nature of stock market investing and that's why we get paid the big bucks further down the track.

"Investing is like exercising for all-round physical fitness. You have to be consistent and accept there's no reward without pain."
post media

Watchlist
Something went wrong while loading your statistics.
Please try again later.
Already have an account?