The buyers’ strike continues.
After Friday’s equity dump, popular positions have been under pressure.
We believe the slide isn’t over. Money flows and history suggests we’re entering the season of volatility.
Last week was a reminder of how fast stocks can reprice. The S&P 500 dropped 3.04% and the tech-heavy NASDAQ 100 fell 5.36%.
After spending years on institutional trading desks, I learned to respect what the Big Money players are doing with their capital. Supply and demand is the ultimate power law for stocks.
When the bids fade, stocks flop…it’s that simple.
The good news is these pullbacks, while unexciting to sit through, eventually offer great deals on high-quality businesses once the buyers’ strike ends.
The less good news, depending on your perspective, is there’s a decent chance the current drawdown isn’t over.
As we’ll dive into, both our data and history indicate we’ll have to ride through more bumps before the market pumps.
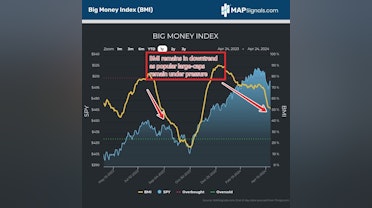
Our data has been down-trending for months. Our North Star, the Big Money Index (BMI), has been falling from extreme overbought conditions since February.
A falling BMI indicates that institutional sponsorship (inflows) is drying up. As you can see, while the rate of decline for the BMI has moderated, it’s still breaking new lows:
Until the tides shift, I still have to keep a cautious stance.
When you dive below the surface, outflows have been seen in one of the hottest areas of the market: Technology.
Ultra-crowded positioning has come under attack.
If you recall, over a month ago, the Technology group in particular suddenly began to drop in rank. This is important for the health of major indices because the sector represents nearly 30% of the S&P 500…by far the largest allocation.
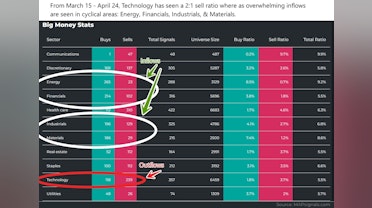
Those areas are still thriving as seen in our sector ranks. This has come at the expense of Technology falling into 7th place:
And this data very much jives with the money flows we’re witnessing. When you study single stock buys and sells since March 15th, Technology has suffered 2:1 outflows.
We see this money rotating into select Energy, Financials, Industrials, and Materials as shown below from our portal:
Data really is beautiful! These powerful clues reveal why following money flows often alerts investors to potential volatility ahead.
I firmly believe we aren’t out of the woods yet for markets. I can see us retesting Friday’s lows…and even experiencing a small bout of capitulation.
There are 2 reasons for this idea. First, inflows into smaller cyclical areas are no match for outflows in mega-cap technology stalwarts.
When the latter comes under pressure, expect indices to remain anchored.
Secondly, history suggests we’re entering the season of volatility.
It’s one thing to have cold hard data guide your trading. It’s another to have those same insights dovetail with hard-hitting historical evidence.
As we showed last week, a free-falling BMI tends to spell trouble for stocks over the near-term. That message didn’t disappoint with Friday experiencing one of the largest pullbacks we’ve witnessed in 2024.
Turns out there’s another reason to expect more near-term bobbing and weaving. Going back to 1998, April 19th – May 19th sees large- and small-caps return lackluster performance.
In this seasonally weak period, the S&P 500 is flat while the S&P Small Cap 600 gains a modest .07%.
But don’t zip your bear suit too tight. Beginning May 20th, seasonal strength kicks into high gear through July with the S&P 500 ramping 1.74% and small-caps flying 2.52%.
The remainder of the year also sees further average gains:
Based on the last 26 years, we’re entering the season of volatility. And this echoes the same message found in our money flow data.
It’s not surprising that the Big Money has already jumped ahead and started selling stocks in front of this historically weak period.
But the important message, that we drive home year after year, is you want to be preparing an all-star buy list.
These selloff events offer outstanding deals on incredible companies at value prices. That’s the playbook we’re gearing up for with our subscribers.
It’s simple.
Near-term, embrace the dip.
Then ride the rip!
A beautiful buy the dip situation is unfolding.
Let’s wrap up.
Here’s the bottom line: Markets are not out of the woods yet. Money is rotating out of big tech and into cyclical areas like Energy, Financials, and Industrials.
But those inflows are no match for outflows in mega-cap giants.
For that reason, expect an anchor on major indices until the selling slows.
Add to it that history proves how stocks tend to show lackluster performance from April 19th – May 19th.
This tells us to ride out the dip…but also prepare for a coming rip!
Let data light the path.
Follow the Big Money!
Opportunities like this rarely come along.
Let a market map lead the way!